
Figures & data
Figure 1. Model membrane proteins. Model membrane proteins consisting of five different membrane anchors (Lck10, Src15, WT and CS Lat34 and GPI) that contain different lipid modifications such as myristoylation (pink) on Src15 and Lck10, palmitoylation (green) on Lck10 and WT Lat34 and GPI (red) were fused to a fluorescent protein.
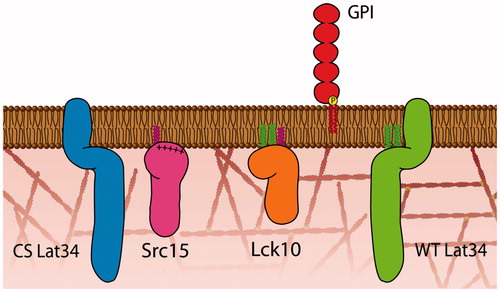
Figure 2. Single molecule localization microscopy reveals nano-scale cluster of model membrane proteins. (A) Single molecule PALM image of Lck10-, Src15-, WT Lat34-, CS Lat34- and GPI-PS-CFP2 in a HeLa cell and corresponding color-coded cluster map generated from local point-pattern analysis. Color code represents clustering, L(r). Bar = 750 nm. (B) Ripley’s K-function of PS-CFP2 tagged to Lck10 (orange), Src15 (pink), WT Lat34 (green), the palmitoylation deficient mutant CS Lat34 (blue) and GPI-AP (red) plotted against the radius, r, of concentric circles centered on each molecule. L(r)-r is a measure for the degree of clustering relative to a random distribution of simulated data (dashed line is the 99% confidence interval).
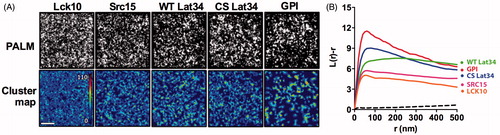
Figure 3. Membrane anchors result in discreet and distinct nano-scaled clustering of PS-CFP2. (A) Maxima of Ripley’s K-function curves at a radius of r = 50 nm. (B) Percentage of molecules in clusters. (C) Number of clusters per μm2. (D) Cluster radii in nm. (B–D) Values obtained from binary, thresholded maps of individual image regions. (A–D) The box extends from the 25th to the 75th percentile. The whiskers show the minimum and the maximum values, horizontal lines indicate the median and (+) indicate means. **p < 0.01, ***p < 0.001 and ****p < 0.0001. Significances were calculated by one-way analysis of variance (ANOVA). For detailed statistics please refer to Supplementary Table S1. Data are from five independent experiments with a total of 9–16 cells.
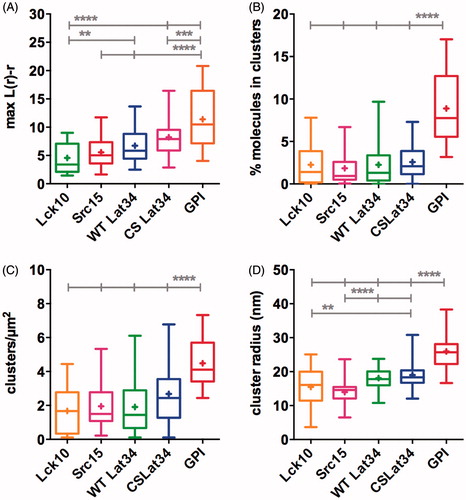
Figure 4. mEOS2 induces clustering of membrane anchors. (A) Ripley’s K-function of mEOS tagged to Lck10 (orange), Src15 (pink), WT Lat34 (green), CS Lat34 (blue) and GPI-AP (red) plotted against the radius (r) of concentric circles centered on each molecule. L(r)-r is a measure for the degree of clustering relative to a random distribution of simulated data (black dashed line is the 99% confidence interval). (B) Maxima of Ripley’s K-function curves at a radius of r = 50 nm. (C) Cluster radii in nm. (D) Number of clusters per μm2. (C, D) Values obtained from binary maps of individual image regions. (B–D) The box extends from the 25th to the 75th percentile. The whiskers show the minimum and the maximum values, horizontal lines indicate the median and (+) indicate means. Light grey asterisk indicate differences between PS-CFP2 and mEOS2-tagged proteins. Dark grey asterisks indicate differences between mEOS2-tagged membrane anchors. *p < 0.05, **p < 0.01, ***p < 0.001 and ****p < 0.0001. Significances were tested with one-way analysis of variance (ANOVA). For detailed statistics please refer to Supplementary Table S1. Data are from four independent experiments with a total of 9–17 cells.
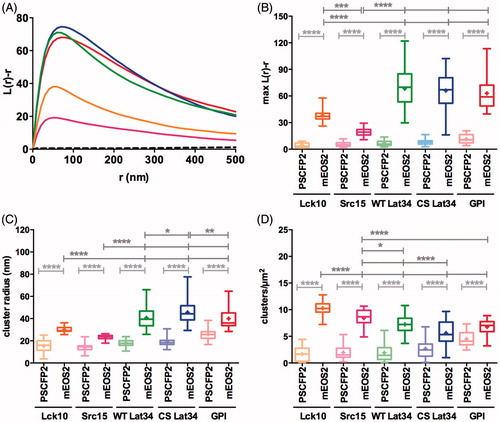
Figure 5. Actin depolymerisation differentially affects clustering of membrane anchors fused to PS-CFP2 and mEOS. To depolymerize actin, cells were treated with 5 μM Latrunculin B (LatB) for 5 min. (A, C) Ripley’s K-function curves of PS-CFP2 (A) and mEOS2 (C) tagged to Lck10 (orange), Src15 (pink), WT Lat34 (green), CS Lat34 (blue) and GPI-AP (red) plotted against the radius (r) of concentric circles centered on each molecule. Dashed lines show Ripley’s K-function curves in untreated control cells; solid lines are Ripley’s K-function curves LatB-treated cells. 99% confidence intervals of random distributions of simulated data are indicated by black dashed line. (B, D) Maxima of Ripley’s K-function curves at a radius of r = 50 nm of PS-CFP2-tagged (B) and mEOS2-tagged (D) membrane anchors of Lck10 (orange), Src15 (pink), WT Lat34 (green), the palmitoylation deficient mutant CS Lat34 (blue) and GPI-AP (red). The box extends from the 25th to the 75th percentile. The whiskers show the minimum and the maximum values, horizontal lines indicate the median and (+) indicate means. *p < 0.05, **p < 0.01, ****p < 0.0001 (one-way analysis of variance [ANOVA]). Data are from two independent experiments with a total of 9–17 cells.
![Figure 5. Actin depolymerisation differentially affects clustering of membrane anchors fused to PS-CFP2 and mEOS. To depolymerize actin, cells were treated with 5 μM Latrunculin B (LatB) for 5 min. (A, C) Ripley’s K-function curves of PS-CFP2 (A) and mEOS2 (C) tagged to Lck10 (orange), Src15 (pink), WT Lat34 (green), CS Lat34 (blue) and GPI-AP (red) plotted against the radius (r) of concentric circles centered on each molecule. Dashed lines show Ripley’s K-function curves in untreated control cells; solid lines are Ripley’s K-function curves LatB-treated cells. 99% confidence intervals of random distributions of simulated data are indicated by black dashed line. (B, D) Maxima of Ripley’s K-function curves at a radius of r = 50 nm of PS-CFP2-tagged (B) and mEOS2-tagged (D) membrane anchors of Lck10 (orange), Src15 (pink), WT Lat34 (green), the palmitoylation deficient mutant CS Lat34 (blue) and GPI-AP (red). The box extends from the 25th to the 75th percentile. The whiskers show the minimum and the maximum values, horizontal lines indicate the median and (+) indicate means. *p < 0.05, **p < 0.01, ****p < 0.0001 (one-way analysis of variance [ANOVA]). Data are from two independent experiments with a total of 9–17 cells.](/cms/asset/287a1ad3-232c-4171-9617-7de2cc867309/imbc_a_990997_f0005_c.jpg)
Figure 6. Membrane order differentially affects clustering of membrane anchors fused to PS-CFP2 and mEOS. Membrane order was decreased by treating cells with 7-ketocholesterol (7KC) for 30 min. (A, C) Ripley’s K-function curves of PS-CFP2 (A) and mEOS2 (C) tagged to Lck10 (orange), Src15 (pink), WT Lat34 (green), CS Lat34 (blue) and GPI-AP (red) plotted against the radius (r) of concentric circles centered on each molecule. Dashed lines show Ripley’s K-function curves in untreated control cells; solid lines are Ripley’s K-function curves 7KC-treated cells. 99% confidence intervals of random distributions of simulated data are indicated by black dashed line. (B, D) Maxima of Ripley’s K-function curves at a radius of r = 50 nm of PS-CFP2-tagged (B) and mEOS2-tagged (D) membrane anchors of Lck10 (orange), Src15 (pink), WT Lat34 (green), CS Lat34 (blue) and GPI-AP (red). (B and D) The box extends from the 25th to the 75th percentile. The whiskers show the minimum and the maximum values, horizontal lines indicate the median and (+) indicate means. Asterisks indicate differences between control and 7KC-treated cells. **p < 0.01, ***p < 0.001 and ****p < 0.0001 (one-way analysis of variance [ANOVA]). Data are from two independent experiments with a total of 9–17 cells.
![Figure 6. Membrane order differentially affects clustering of membrane anchors fused to PS-CFP2 and mEOS. Membrane order was decreased by treating cells with 7-ketocholesterol (7KC) for 30 min. (A, C) Ripley’s K-function curves of PS-CFP2 (A) and mEOS2 (C) tagged to Lck10 (orange), Src15 (pink), WT Lat34 (green), CS Lat34 (blue) and GPI-AP (red) plotted against the radius (r) of concentric circles centered on each molecule. Dashed lines show Ripley’s K-function curves in untreated control cells; solid lines are Ripley’s K-function curves 7KC-treated cells. 99% confidence intervals of random distributions of simulated data are indicated by black dashed line. (B, D) Maxima of Ripley’s K-function curves at a radius of r = 50 nm of PS-CFP2-tagged (B) and mEOS2-tagged (D) membrane anchors of Lck10 (orange), Src15 (pink), WT Lat34 (green), CS Lat34 (blue) and GPI-AP (red). (B and D) The box extends from the 25th to the 75th percentile. The whiskers show the minimum and the maximum values, horizontal lines indicate the median and (+) indicate means. Asterisks indicate differences between control and 7KC-treated cells. **p < 0.01, ***p < 0.001 and ****p < 0.0001 (one-way analysis of variance [ANOVA]). Data are from two independent experiments with a total of 9–17 cells.](/cms/asset/b026002e-8288-4f6d-9343-2e6630db1d20/imbc_a_990997_f0006_c.jpg)