Figures & data
Figure 1. Percentages of different shapes of erythrocytes induced by CGA at 0.05 mg/ml (grey bar) and 0.01 mg/ml (black bar) concentration, control (white bar). Results are expressed as average ± SD (n = 5). Various erythrocyte shapes are given morphological indices as follows: Spherostomatocytes (−4), stomatocytes II (−3), stomatocytes I (−2), discostomatocytes (−1), discocytes (0), discoechinocytes (1), echinocytes (2), spheroechinocytes (3), spherocytes (4). Statistical analysis was conducted using the Dunnett test. Statistically significant results are denoted by **α = 0.01, *α = 0.05.
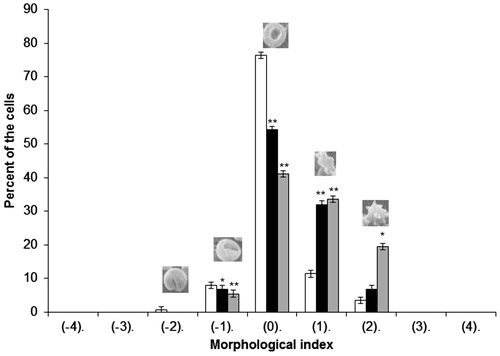
Figure 2. Shapes of unmodified erythrocytes (A) and modified with CGA (B) observed with electron microscope at 0.05 mg/ml concentration.
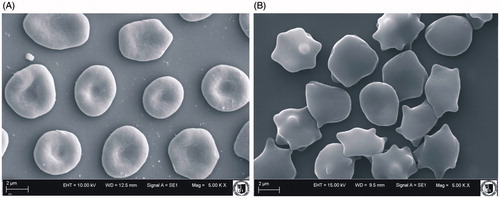
Table 1. Values of fluorescence anisotropy (A) of DPH and TMA-DPH probes for erythrocyte membranes and liposomes formed of erythrocyte lipids (RBCL) modified by CGA at 37 °C. Results are expressed as average ± SD (n = 5). The statistical significance of differences between average values of A and Acontrol was checked using the Dunnett test (<Acontrol).
Figure 3. Values of generalized polarization (GP) of Laurdan probe for erythrocyte membrane (□) and RBCL (▪) modified with CGA at 37 °C. Results are expressed as average ± SD (n = 5). Statistical analysis was conducted using Dunnett’s test. Statistically significant results at: *α = 0.05, **α = 0.01.
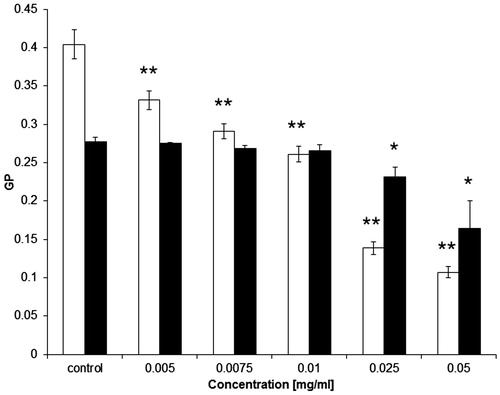
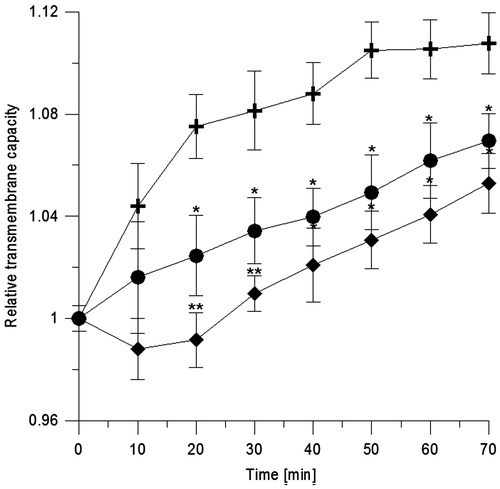
Figure 4. Relative transmembrane capacity of BLM formed of erythrocyte lipids vs. time. Control symbol is (+) and in the presence of CGA at 0.001 mg/ml (•) and 0.01 mg/ml (♦). Statistical significance of differences between average values of capacitance for modified (C) and unmodified (C0) BLM was checked using the Dunnett test. Statistically significant results at *α = 0.05 and **α = 0.01.