Figures & data
Figure 1. Representation of cholesterol and POPC molecules in CG and AT. (A) CG structure of cholesterol. Polar head-group bead (ROH) is shown in red, ring beads (R1–R5) in blue, tail beads (C1–C2) in cyan. Connectivity between beads is shown with sticks. The arrow marks the position (R2 site) which would correspond to the brominated site. (B) AT structure of cholesterol in stick representation. Non-polar hydrogens are not shown, oxygen is shown in red and carbons in cyan. (C) CG structure of POPC. Choline bead is shown in blue, phosphate bead in purple, glycerol linkage beads in red and hydrophobic tail beads in cyan. (D) AT structure of POPC in stick representation. Hydrogens are not shown, oxygen in red, nitrogen in blue, phosphorus in purple and carbons in cyan.
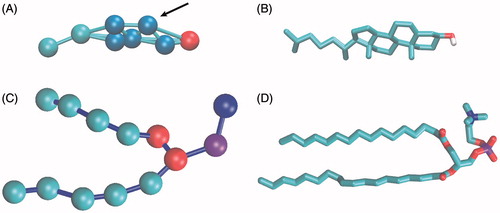
Figure 2. SERCA-bilayer self-assembly during the CG simulations. SERCA is shown as a backbone trace and colored by domains as follows: A-domain in yellow, N-domain in red, P-domain in blue, TM1–2 in pink, TM3–4 in green, TM5–6 in violet and TM7–10 in ochre. Lipids are shown as cyan sticks with the phosphate bead as a purple sphere. Water and ion beads are omitted for clarity. Cholesterol is shown as blue sticks with the polar head bead as a red sphere. (A) Starting structure with the CG representation of SERCA positioned in the middle of the box and lipids and cholesterol scattered around with random positions and orientations. (B) Snapshot after 120 ns of simulation, just before release of the position restraints on the protein backbone beads. (C) Snapshot after 1.32 μs of simulation of which the last 1.2 μs were run without position restraints and the protein represented with a MARTINI-ELNEDYN model (Periole et al., Citation2009). For more snapshots from the self-assembly process, see Figure S1 in the Supplementary Material, available online.
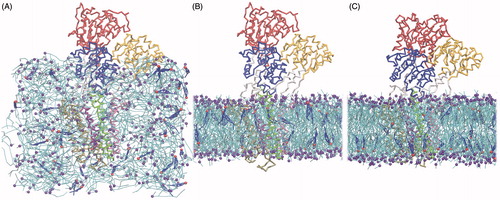
Figure 3. Membrane components interacting with SERCA. (A) and (B) Snapshots of lipid and cholesterol molecules in direct interaction with SERCA, defining an annulus around the TM part of the protein. (A) The SERCA TM domain is shown as gray surface representation. Lipids are represented as cyan sticks with the phosphate beads as purple spheres. Cholesterol molecules are shown as blue sticks with the polar head as red spheres. (B) The same snapshot as in A, but viewed along the membrane normal and omitting the protein. (C) Graph displaying protein interaction events for lipids (blue) and cholesterol (red) in the last 600 ns of one of the CG simulations. The vertical axis reflects the number of different lipid and cholesterol molecules interacting with SERCA in the analyzed time frame. The molecules are ordered according to their first encounter with SERCA. A horizontal line is made for the period where a specific molecule is interacting with SERCA, the lengths of the lines thus indicate the longevity of the interactions.
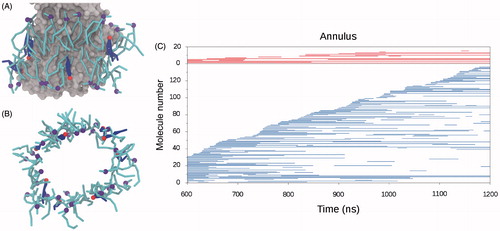
Figure 4. (A–D) Potential binding pockets on the TM surface of SERCA (PDB ID 2C8K). SERCA is shown in surface representation with TM1-2 colored pink, TM3–4 green, TM5–6 purple and TM7–10 brown. Blue, transparent patches indicate the cavities. (E–H) Residues in SERCA colored based on their level of interaction with cholesterol. The view angles as the same as those in panels A–D. The color scale goes from red (cholesterol contact registered in 80% of the ∼6000 analyzed snapshots) over white to blue (no cholesterol contact registered in the ∼6000 analyzed snapshots). Panels (A) and (E) The thapsigargin binding pocket; (B) and (F) The C-terminal pocket; (C) and (G) The sarcolipin binding pocket; (D) and (H) The TM1–TM3 pocket.
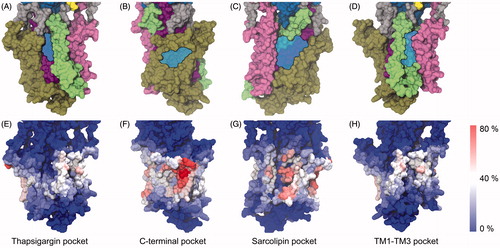
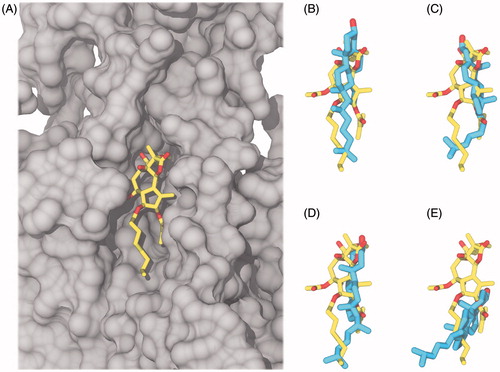
Figure 5. Examples of potential non-annular binding modes of cholesterol in the four pockets on the surface of SERCA. Snapshots are from the end of the CG simulations showing molecules which have stayed in a stable binding mode for the last 600 ns of simulation. SERCA is shown in surface representation with TM1–TM2 colored pink, TM3–TM4 colored green, TM5–TM6 colored violet and TM7-TM10 colored light brown. Cholesterol is shown as blue sticks with the polar head as a red sphere. (A) Binding in the thapsigargin pocket; (B) binding in the TM1–TM3 pocket; (C) binding in the sarcolipin pocket; (D) binding in the C-terminal pocket.
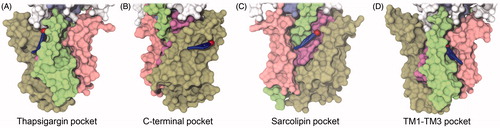
Figure 6. Comparison of cholesterol (cyan carbon atoms) and thapsigargin (yellow carbon atoms) in the thapsigargin pocket after 100 ns, aligned according to Cα positions in the membrane spanning part of the TM helices. Oxygen atoms are colored red, SERCA is represented by a gray surface. (A) Thapsigargin in the crystal structure and a collection of the final snapshots of cholesterol in (B) Thaps_0deg#1 (C) Thaps_0deg#2 (D) Thaps_180deg#1 (E) Thaps_180deg#2.