Figures & data
Figure 1. Root mean square deviations (RMSD) of the serotonin1A receptor along the trajectory calculated for (a, c, e) all and (b, d, f) backbone atoms in POPC (red) and POPC/cholesterol (black) bilayers. Panels (a, b) represent the RMSD for model 1 (0.1 M NaCl), (c, d) for model 2 (0 M NaCl) and (e, f) for model 3 (0 M NaCl). See Methods for other details (For interpretation of the references to color in this figure legend, the reader is referred to the web version of this article).
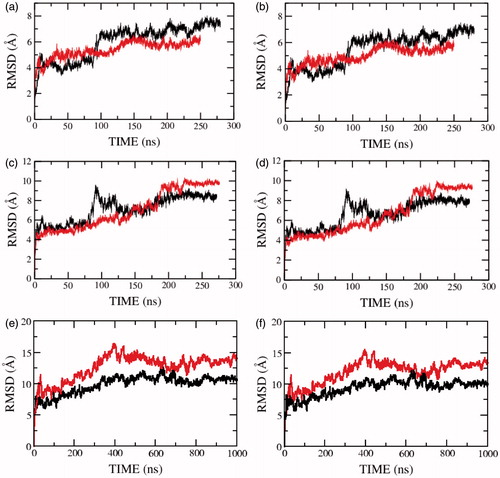
Figure 2. RMSD of the serotonin1A receptor along the trajectory calculated for (a, c, e) all and (b, d, f) backbone atoms of all transmembrane helices in POPC (red) and POPC/cholesterol (black) bilayers. Panels (a, b) represent the RMSD for model 1 (0.1 M NaCl), (c, d) for model 2 (0 M NaCl) and (e, f) for model 3 (0 M NaCl). See Methods for other details (For interpretation of the references to color in this figure legend, the reader is referred to the web version of this article).
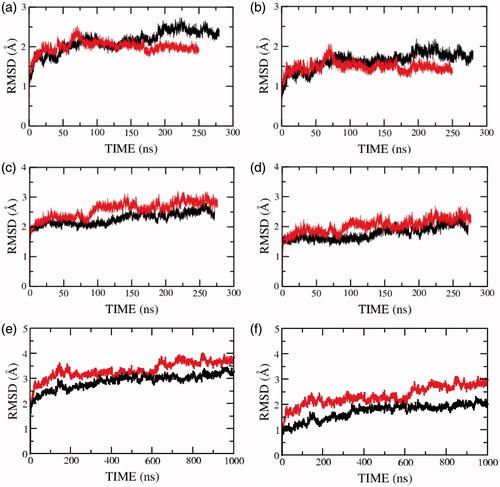
Figure 3. RMSD of the serotonin1A receptor in POPC (red) and POPC/cholesterol (black) bilayers in presence of NaCl (model 1) calculated for transmembrane helix (a) I, (b) II, (c) III, (d) IV, (e) V, (f) VI, (g) VII and (h) carboxy terminal helix VIII. See Methods and Supplementary Table 2 for further details (For interpretation of the references to color in this figure legend, the reader is referred to the web version of this article).
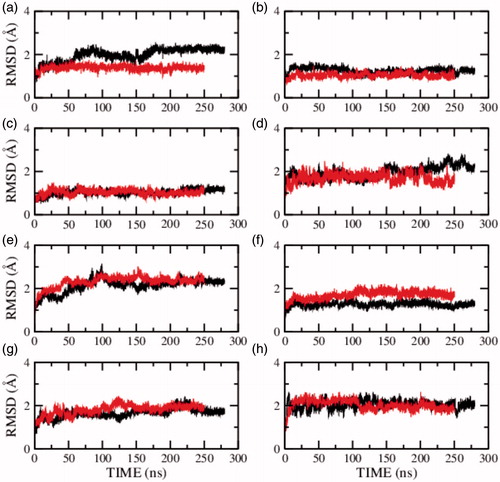
Figure 4. RMSD of the serotonin1A receptor in POPC (red) and POPC/cholesterol (black) bilayers in the absence of NaCl (model 2) calculated for transmembrane helix (a) I, (b) II, (c) III, (d) IV, (e) V, (f) VI, (g) VII and (h) carboxy terminal helix VIII. See Methods and Supplementary Table 2 for further details (For interpretation of the references to color in this figure legend, the reader is referred to the web version of this article).
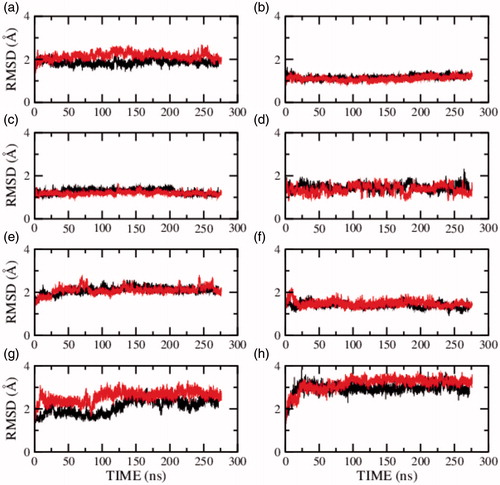
Figure 5. RMSD of the serotonin1A receptor in POPC (red) and POPC/cholesterol (black) bilayers in absence of NaCl (model 3) calculated for transmembrane helix (a) I, (b) II, (c) III, (d) IV, (e) V, (f) VI, (g) VII and (h) carboxy terminal helix VIII. See Methods and Supplementary Table 2 for further details (For interpretation of the references to color in this figure legend, the reader is referred to the web version of this article).
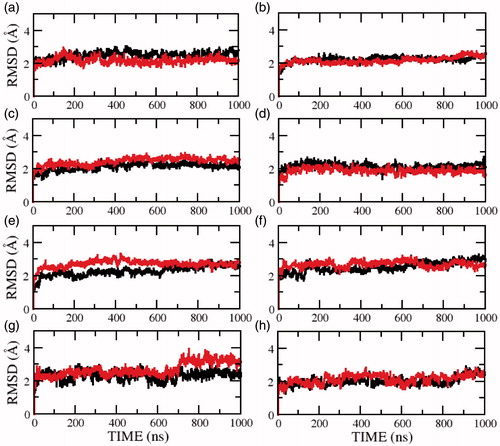
Figure 6. Superposition of initial and final structures of the serotonin1A receptor. The structures correspond to the starting structure (blue) and the structures after 100 ns of simulation in POPC (red) and POPC/cholesterol (green) bilayers in the three models. The structures are represented for (a) model 1, (b) model 2 and (c) model 3 (For interpretation of the references to color in this figure legend, the reader is referred to the web version of this article).
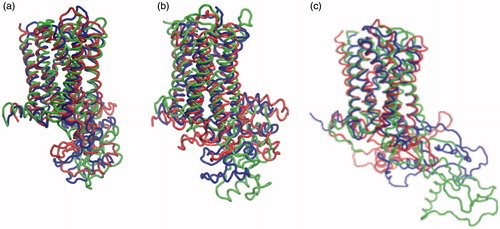
Figure 7. The radial distribution function, g(r), of cholesterol around the transmembrane helices of the serotonin1A receptor in model 3. The transmembrane helices have been distinguished as those in the (a) extracellular leaflet and (b) intracellular leaflet. The color coding corresponds to transmembrane helix I (black), II (red), III (green), IV (blue), V (yellow), VI (brown) and VII (gray) (For interpretation of the references to color in this figure legend, the reader is referred to the web version of this article).
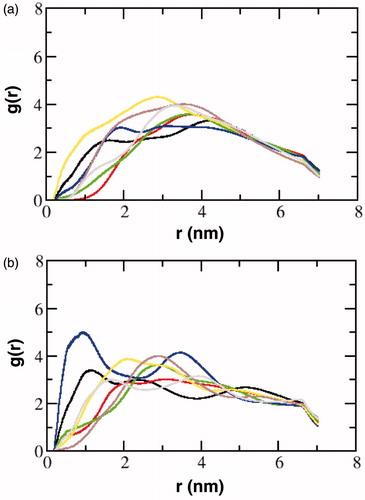
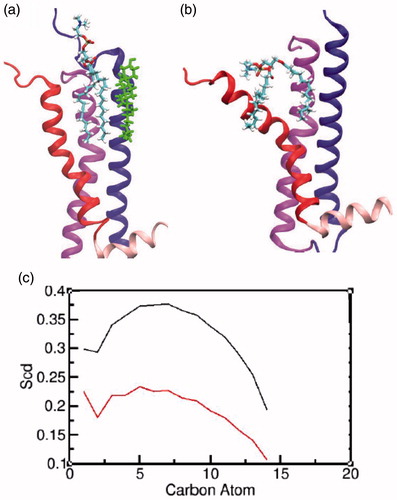
Figure 8. Characterizing the interaction of POPC at the groove of transmembrane helices I and VII: a schematic representation of a POPC molecule at the site in the (a) presence and (b) absence of cholesterol. The transmembrane helices I, II and VII and helix VIII are represented in blue, magenta, red and light pink, respectively. The cholesterol molecule is shown in green and POPC molecule is colored by atom type (carbon: cyan, phosphate: brown, hydrogen: white, nitrogen: blue and oxygen: red). (c) The order parameters calculated for the carbon atoms of the palmitoyl chain for the two POPC molecules in the presence (black) and absence (red) of cholesterol (For interpretation of the references to color in this figure legend, the reader is referred to the web version of this article).