Figures & data
Figure 1. Methods for acquiring high-resolution NMR spectra. (A) Rapid and random tumbling of molecules in a solution-state NMR sample. (B) The solid-state NMR magic-angle spinning (MAS) experiment. A solid or semi-solid sample packed into the centre of a cylindrical rotor (outside diameter 1.3–15 mm) is rapidly spun (typically at frequencies of 1–35 kHz) in the NMR magnet about an angle of 54.7° relative to the applied magnetic field (B0) (Andrew et al., Citation1958, Citation1959; Lowe, Citation1959). (C) The solid-state NMR cross-polarization (CP) experiment. The basic CP pulse sequence transfers magnetization excited on abundant 1H nuclei to dilute low gyromagnetic ratio nuclei (X = 13C, 15N, etc) during a ‘contact’ period (Pines et al., Citation1973). During the contact time, radiofrequency fields for both 1H and X are turned on and the ratio of power levels between 1H and X are made equal to the ratio of their gyromagnetic ratios () under Hartmann-Hahn matching conditions (Hartmann & Hahn, Citation1962). Following the contact time, the enhanced magnetization on the X nuclei is detected whilst the abundant protons are decoupled. Recycling of the pulse sequence is dependent on T1H and not T1X, which allows accumulation of many more repetitions in a given time. The pictures in B and C were modified from Middleton and Patching (Citation2013).
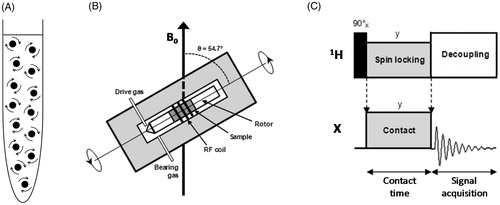
Figure 2. Oriented samples of a membrane protein in a mechanically aligned lipid bilayer and in magnetically aligned bicelles. Orientation of a membrane protein mechanically aligned in a lipid bilayer on glass plates (A), magnetically aligned in bicelles with the bilayer normal perpendicular to the direction of the magnetic field (B) and magnetically aligned in flipped bicelles with the bilayer normal parallel to the direction of the magnetic field (C). The arrow indicates the direction of the magnetic field. This picture was modified with permission from Kim (Citation2006), which was originally published in Bull Korean Chem Soc [Kim Y. Citation2006. Solid-state NMR studies of membrane proteins using phospholipid bicelles. Bull Korean Chem Soc 27:386–388], copyright by Korean Chemical Society 2006.
![Figure 2. Oriented samples of a membrane protein in a mechanically aligned lipid bilayer and in magnetically aligned bicelles. Orientation of a membrane protein mechanically aligned in a lipid bilayer on glass plates (A), magnetically aligned in bicelles with the bilayer normal perpendicular to the direction of the magnetic field (B) and magnetically aligned in flipped bicelles with the bilayer normal parallel to the direction of the magnetic field (C). The arrow indicates the direction of the magnetic field. This picture was modified with permission from Kim (Citation2006), which was originally published in Bull Korean Chem Soc [Kim Y. Citation2006. Solid-state NMR studies of membrane proteins using phospholipid bicelles. Bull Korean Chem Soc 27:386–388], copyright by Korean Chemical Society 2006.](/cms/asset/0a03a959-ebc6-4a25-9f5a-889435f38f68/imbc_a_1139754_f0002_b.jpg)
Figure 3. Structure determination of the fd bacteriophage pVIII coat protein using oriented samples and PISEMA solid-state NMR. (A) Sequence of the 50-residue fd bacteriophage pVIII coat protein indicating residues that comprise an amphipathic helix (8–18) and a transmembrane helix (21–45). Residues selectively 15N-labelled in separate samples are highlighted with colours: Ala (red), Gly (yellow), Leu (green), Val (blue). (B) Experimental PISEMA spectrum obtained from uniformly 15N-labelled protein in POPC/POPG bilayers. (C) Pisa wheel PISEMA spectrum calculated from a protein model with the amphipathic helix parallel to within 3° of the membrane surface and the transmembrane helix with a tilt angle of 30°. The helical and Pisa wheel rotations are set to match the resonances in the experimental PISEMA spectra from the Ala (red), Gly (yellow), Leu (green), and Val (blue) residues. (D) Structure of the fd bacteriophage pVIII coat protein in POPC/POPG bilayers. The structure is coloured with the N-terminus in blue (top left) and the C-terminus in red (bottom). The dashed grey line represents the membrane-water interface and the arrow represents the direction of the magnetic field. The pictures in A–C were reproduced with permission from Marassi and Opella (Citation2003), which were originally published in Prot Sci [Marassi FM, Opella SJ. Citation2003. Simultaneous assignment and structure determination of a membrane protein from NMR orientational restraints. Protein Sci 12:403–411.], copyright by The Protein Society 2003. The structure in D was drawn from the PDB file 1MZT using Jmol: An open-source Java viewer for chemical structures in 3D (http://www.jmol.org/) (Herráez, Citation2006). This Figure is reproduced in colour in Molecular Membrane Biology online.
![Figure 3. Structure determination of the fd bacteriophage pVIII coat protein using oriented samples and PISEMA solid-state NMR. (A) Sequence of the 50-residue fd bacteriophage pVIII coat protein indicating residues that comprise an amphipathic helix (8–18) and a transmembrane helix (21–45). Residues selectively 15N-labelled in separate samples are highlighted with colours: Ala (red), Gly (yellow), Leu (green), Val (blue). (B) Experimental PISEMA spectrum obtained from uniformly 15N-labelled protein in POPC/POPG bilayers. (C) Pisa wheel PISEMA spectrum calculated from a protein model with the amphipathic helix parallel to within 3° of the membrane surface and the transmembrane helix with a tilt angle of 30°. The helical and Pisa wheel rotations are set to match the resonances in the experimental PISEMA spectra from the Ala (red), Gly (yellow), Leu (green), and Val (blue) residues. (D) Structure of the fd bacteriophage pVIII coat protein in POPC/POPG bilayers. The structure is coloured with the N-terminus in blue (top left) and the C-terminus in red (bottom). The dashed grey line represents the membrane-water interface and the arrow represents the direction of the magnetic field. The pictures in A–C were reproduced with permission from Marassi and Opella (Citation2003), which were originally published in Prot Sci [Marassi FM, Opella SJ. Citation2003. Simultaneous assignment and structure determination of a membrane protein from NMR orientational restraints. Protein Sci 12:403–411.], copyright by The Protein Society 2003. The structure in D was drawn from the PDB file 1MZT using Jmol: An open-source Java viewer for chemical structures in 3D (http://www.jmol.org/) (Herráez, Citation2006). This Figure is reproduced in colour in Molecular Membrane Biology online.](/cms/asset/a37c4b96-34d3-4607-8ac2-bdfb06f6d916/imbc_a_1139754_f0003_c.jpg)
Figure 4. Measurement of parallel and perpendicular edges of motionally averaged powder patterns from MAS spectra of unoriented samples. MAS solid-state 15N NMR spectra of 15N-leucine-11 labelled transmembrane domain of HIV Vpu channel in unoriented DMPC lipid bilayers. In each panel (A–D) the three spectra represent a powder pattern calculated from experimental sideband intensities (top), sideband intensities ‘back calculated’ from the powder pattern (middle) and the experimental NMR spectrum (bottom). Experimental spectra were obtained at high temperature (30 °C, A and B) and at low temperature (5 °C, C and D) and using MAS frequencies of 2.2 kHz (A and C) and 3.0 kHz (B and D). This Figure was reproduced with permission from Park et al. (Citation2010a), which was originally published in J Phys Chem B [Park SH, Das BB, De Angelis AA, Scrima M, Opella SJ Citation2010a. Mechanically, magnetically, and “rotationally aligned” membrane proteins in phospholipid bilayers give equivalent angular constraints for NMR structure determination. J Phys Chem B 114:13995–14003], copyright by American Chemical Society 2010.
![Figure 4. Measurement of parallel and perpendicular edges of motionally averaged powder patterns from MAS spectra of unoriented samples. MAS solid-state 15N NMR spectra of 15N-leucine-11 labelled transmembrane domain of HIV Vpu channel in unoriented DMPC lipid bilayers. In each panel (A–D) the three spectra represent a powder pattern calculated from experimental sideband intensities (top), sideband intensities ‘back calculated’ from the powder pattern (middle) and the experimental NMR spectrum (bottom). Experimental spectra were obtained at high temperature (30 °C, A and B) and at low temperature (5 °C, C and D) and using MAS frequencies of 2.2 kHz (A and C) and 3.0 kHz (B and D). This Figure was reproduced with permission from Park et al. (Citation2010a), which was originally published in J Phys Chem B [Park SH, Das BB, De Angelis AA, Scrima M, Opella SJ Citation2010a. Mechanically, magnetically, and “rotationally aligned” membrane proteins in phospholipid bilayers give equivalent angular constraints for NMR structure determination. J Phys Chem B 114:13995–14003], copyright by American Chemical Society 2010.](/cms/asset/70751f93-e7ca-472d-b3d0-490478c8ed07/imbc_a_1139754_f0004_b.jpg)
Figure 5. Gallery of solid-state NMR structures of integral membrane proteins. Backbone structures are shown for integral membrane proteins that have been determined by solid-state NMR or by solid-state NMR in combination with another technique (e.g., crystallography, solution-state NMR) and that have a PDB entry and have been published in a peer-reviewed journal (up to October 2015). Proteins are arranged (β-strand then α-helical transmembrane domain) in order of increasing size and complexity and they correspond with the details given in . Structures are coloured with the N-terminus in blue and the C-terminus in red. Structures were drawn with the given PDB file using Jmol: an open-source Java viewer for chemical structures in 3D (http://www.jmol.org/) (Herráez, Citation2006). This Figure is reproduced in colour in Molecular Membrane Biology online.
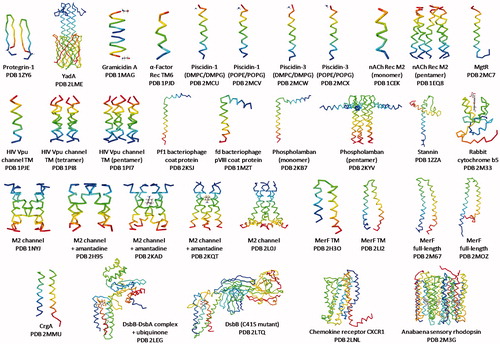
Table 1. Details of solid-state NMR structures of integral membrane proteins. Information is provided for structures of integral membrane proteins that have been determined by solid-state NMR or by solid-state NMR in combination with another technique (e.g., solution-state NMR, X-ray crystallography) and that have a PDB entry and have been published in a peer-reviewed journal (up to October 2015). Proteins are listed (β-strand then α-helical transmembrane domain) in order of increasing size and complexity and they correspond with the structures shown in .
Figure 6. Solid-state NMR structure of the autotransporter adhesion protein YadA. This backbone structure is coloured with the N-terminus in blue (top) and the C-terminus in red. The structure was drawn with PDB file 2LME using Jmol: An open-source Java viewer for chemical structures in 3D (http://www.jmol.org/) (Herráez, Citation2006). This Figure is reproduced in colour in Molecular Membrane Biology online.
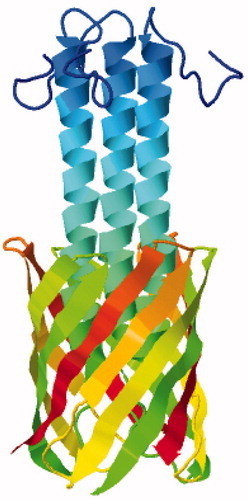
Figure 7. Solid-state NMR structure of the ion channel gramicidin A. Structure of gramicidin A viewed from the side (left) and from the top (right) coloured to distinguish the two head-to-head helices of the dimer (red and blue). The structure was drawn with PDB file 1MAG using Jmol: An open-source Java viewer for chemical structures in 3D (http://www.jmol.org/) (Herráez, Citation2006). This Figure is reproduced in colour in Molecular Membrane Biology online.
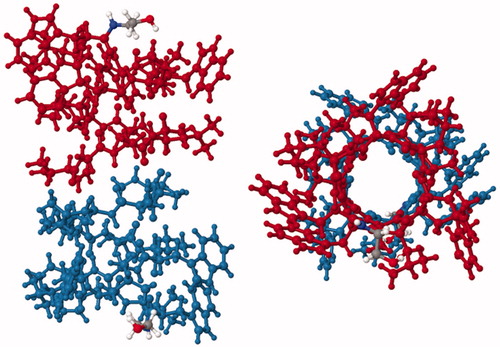
Figure 8. Backbone structures of the HIV Vpu channel transmembrane domain. Structures were determined by solution-state NMR in DHPC micelles (A), by solid-state NMR mechanically aligned on glass plates in DOPC/DOPG bilayers (B) (PDB 1PJE) and by solid-state NMR magnetically aligned in 16-O-PC/6-O-PC bicelles (C) (PDB 2GOH) and in 14-O-PC/6-O-PC bicelles (D) (PDB 2GOF). The Cα of Ile17 is indicated to show the position of the kink and the grey boxes indicate the thickness of the hydrophobic region of the lipid bilayers. This Figure was reproduced with permission from Park et al. (Citation2006), which was originally published in Biophys J [Park SH, De Angelis AA, Nevzorov AA, Wu CH, Opella SJ Citation2006. Three-dimensional structure of the transmembrane domain of Vpu from HIV-1 in aligned phospholipid bicelles. Biophys J 91:3032–3042], copyright by The Biophysical Society 2006.
![Figure 8. Backbone structures of the HIV Vpu channel transmembrane domain. Structures were determined by solution-state NMR in DHPC micelles (A), by solid-state NMR mechanically aligned on glass plates in DOPC/DOPG bilayers (B) (PDB 1PJE) and by solid-state NMR magnetically aligned in 16-O-PC/6-O-PC bicelles (C) (PDB 2GOH) and in 14-O-PC/6-O-PC bicelles (D) (PDB 2GOF). The Cα of Ile17 is indicated to show the position of the kink and the grey boxes indicate the thickness of the hydrophobic region of the lipid bilayers. This Figure was reproduced with permission from Park et al. (Citation2006), which was originally published in Biophys J [Park SH, De Angelis AA, Nevzorov AA, Wu CH, Opella SJ Citation2006. Three-dimensional structure of the transmembrane domain of Vpu from HIV-1 in aligned phospholipid bicelles. Biophys J 91:3032–3042], copyright by The Biophysical Society 2006.](/cms/asset/a00fc5bb-101e-47e6-846b-57a9026fcff6/imbc_a_1139754_f0008_b.jpg)
Figure 9. Solid-state NMR structure of the amantadine-bound M2 proton channel from influenza A virus in lipid bilayers. (A) Side view showing residues Val27, Ser31, Gly34, His37 and Trp41 and amantadine in the high-affinity binding site. (B) Top view showing the Val27 and Ser31 pore radii and amantadine in the high-affinity binding site. This picture was reproduced with permission from Cady et al. (Citation2010), which was originally published in Nature [Cady SD, Schmidt-Rohr K, Wang J, Soto CS, Degrado WF, Hong M. Citation2010. Structure of the amantadine binding site of influenza M2 proton channels in lipid bilayers. Nature 463:689–692], copyright by Nature Publishing Group 2010. This Figure is reproduced in colour in Molecular Membrane Biology online.
![Figure 9. Solid-state NMR structure of the amantadine-bound M2 proton channel from influenza A virus in lipid bilayers. (A) Side view showing residues Val27, Ser31, Gly34, His37 and Trp41 and amantadine in the high-affinity binding site. (B) Top view showing the Val27 and Ser31 pore radii and amantadine in the high-affinity binding site. This picture was reproduced with permission from Cady et al. (Citation2010), which was originally published in Nature [Cady SD, Schmidt-Rohr K, Wang J, Soto CS, Degrado WF, Hong M. Citation2010. Structure of the amantadine binding site of influenza M2 proton channels in lipid bilayers. Nature 463:689–692], copyright by Nature Publishing Group 2010. This Figure is reproduced in colour in Molecular Membrane Biology online.](/cms/asset/8851cbea-d892-47c0-a5d3-d606b10d202c/imbc_a_1139754_f0009_c.jpg)
Figure 10. Comparison of truncated and full-length MerF solid-state NMR structures. The structure of the truncated 60-residue protein (magenta) is superimposed on the structure of the full-length 81-residue protein (aqua). A position of negligible conformational change (Ala52) and the position of large conformational change (Ala19) are indicated. This picture was reproduced with permission from Lu et al. (Citation2013), which was originally published in J Am Chem Soc [Lu GJ, Tian Y, Vora N, Marassi FM, Opella SJ Citation2013. The structure of the mercury transporter MerF in phospholipid bilayers: A large conformational rearrangement results from N-terminal truncation. J Am Chem Soc 135:9299–9302], copyright by American Chemical Society 2013. This Figure is reproduced in colour in Molecular Membrane Biology online.
![Figure 10. Comparison of truncated and full-length MerF solid-state NMR structures. The structure of the truncated 60-residue protein (magenta) is superimposed on the structure of the full-length 81-residue protein (aqua). A position of negligible conformational change (Ala52) and the position of large conformational change (Ala19) are indicated. This picture was reproduced with permission from Lu et al. (Citation2013), which was originally published in J Am Chem Soc [Lu GJ, Tian Y, Vora N, Marassi FM, Opella SJ Citation2013. The structure of the mercury transporter MerF in phospholipid bilayers: A large conformational rearrangement results from N-terminal truncation. J Am Chem Soc 135:9299–9302], copyright by American Chemical Society 2013. This Figure is reproduced in colour in Molecular Membrane Biology online.](/cms/asset/fb4706be-12a6-4e8c-85b6-e2fbb369720f/imbc_a_1139754_f0010_c.jpg)
Figure 11. Solid-state NMR refinement of the DsbB (C41S mutant) transmembrane domain crystal structure. (A) Overlay of 10 lowest energy structures of DsbB (Cys41Ser) calculated using only X-ray reflections (PDB 2ZUQ) with a backbone RMSD of 2.36 Å. (B) Overlay of 10 lowest energy structures of DsbB (Cys41Ser) calculated using X-ray reflections and solid-state NMR restraints (PDB 2LTQ) with a backbone RMSD of 1.35 Å. The structure is coloured magenta, cyan and white to represent the secondary structure elements α-helix, coil and turn, respectively. This picture was modified with permission from Tang et al. (Citation2013b), which was originally published in J Mol Biol [Tang M, Nesbitt AE, Sperling LJ, Berthold DA, Schwieters CD, Gennis RB, Rienstra CM Citation2013b. Structure of the disulfide bond generating membrane protein DsbB in the lipid bilayer. J Mol Biol 425:1670–1682], copyright by Elsevier Ltd 2013. This Figure is reproduced in colour in Molecular Membrane Biology online.
![Figure 11. Solid-state NMR refinement of the DsbB (C41S mutant) transmembrane domain crystal structure. (A) Overlay of 10 lowest energy structures of DsbB (Cys41Ser) calculated using only X-ray reflections (PDB 2ZUQ) with a backbone RMSD of 2.36 Å. (B) Overlay of 10 lowest energy structures of DsbB (Cys41Ser) calculated using X-ray reflections and solid-state NMR restraints (PDB 2LTQ) with a backbone RMSD of 1.35 Å. The structure is coloured magenta, cyan and white to represent the secondary structure elements α-helix, coil and turn, respectively. This picture was modified with permission from Tang et al. (Citation2013b), which was originally published in J Mol Biol [Tang M, Nesbitt AE, Sperling LJ, Berthold DA, Schwieters CD, Gennis RB, Rienstra CM Citation2013b. Structure of the disulfide bond generating membrane protein DsbB in the lipid bilayer. J Mol Biol 425:1670–1682], copyright by Elsevier Ltd 2013. This Figure is reproduced in colour in Molecular Membrane Biology online.](/cms/asset/5780e973-b1fa-4855-a5ea-7de180259516/imbc_a_1139754_f0011_c.jpg)
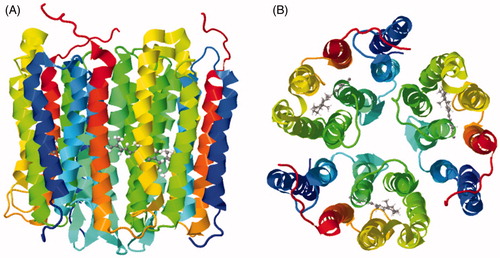
Figure 12. Solid-state NMR structure of the human chemokine receptor CXCR1 in lipid bilayers. (A) Side view. (B) Top view from the extracellular surface. (C) Bottom view from the intracellular surface. The structure is coloured with the N-terminus in blue and the C-terminus in red. These structures were drawn from the PDB file 2LNL using using Jmol: An open-source Java viewer for chemical structures in 3D (http://www.jmol.org/) (Herráez, Citation2006). This Figure is reproduced in colour in Molecular Membrane Biology online.
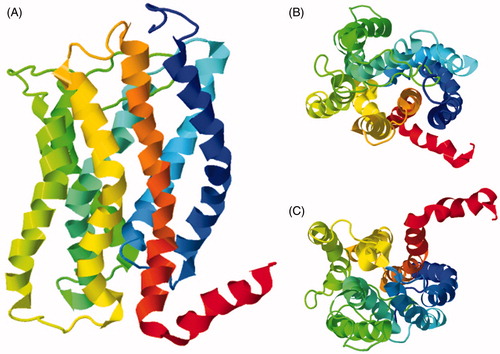
Figure 13. Solid-state NMR structure of Anabaena sensory rhodopsin in lipid bilayers. (A) Side view. (B) Top view from the extracellular surface. The structure is coloured with the N-terminus in blue and the C-terminus in red and the retinal cofactor molecule is coloured grey. These structures were drawn from the PDB file 2M3G using Jmol: an open-source Java viewer for chemical structures in 3D (http://www.jmol.org/) (Herráez, Citation2006). This Figure is reproduced in colour in Molecular Membrane Biology online.