Publication Cover
Stress
The International Journal on the Biology of Stress
Volume 14, 2011 - Issue 2
663
Views
18
CrossRef citations to date
0
Altmetric
Original Research Reports

Fear-related pictures deteriorate the performance of university students with high fear of snakes or spiders

, , , &
Pages 185-193 | Received 21 Feb 2010, Accepted 23 Sep 2010, Published online: 31 Oct 2010

Figures & data

Figure 1.  An example of a valid trial in Experiment 1. A fixation cross appears for 500 ms, followed by a 200 ms blank interval. After the interval, one of the peripheral rectangles flashes for 100 ms. Following a variable SOA of 140 or 160 ms, a target letter appears in the cued peripheral rectangle. Simultaneously with the target's appearance, a distracting picture appears in the other peripheral rectangle for 100 ms (ms, milliseconds; SOA, stimulus onset asynchrony).
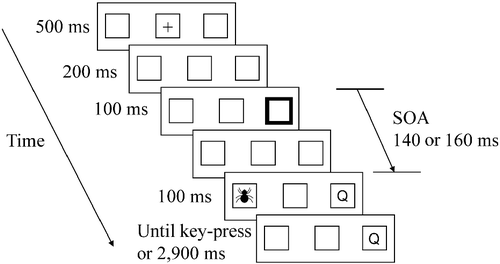
Figure 1.  An example of a valid trial in Experiment 1. A fixation cross appears for 500 ms, followed by a 200 ms blank interval. After the interval, one of the peripheral rectangles flashes for 100 ms. Following a variable SOA of 140 or 160 ms, a target letter appears in the cued peripheral rectangle. Simultaneously with the target's appearance, a distracting picture appears in the other peripheral rectangle for 100 ms (ms, milliseconds; SOA, stimulus onset asynchrony).

Figure 2.  An example of a trial in Experiment 2. A fixation cross appears for 500 ms. After the fixation, a target letter appears alone, or with additional one, three, or five distracting letters for 200 ms. Simultaneously with the letters' appearance, a distracting picture appears in the center of the screen for 200 ms in half of the trials (ITI, inter-trial interval; ms, milliseconds).
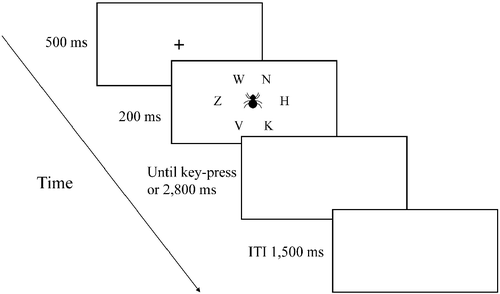
Figure 2.  An example of a trial in Experiment 2. A fixation cross appears for 500 ms. After the fixation, a target letter appears alone, or with additional one, three, or five distracting letters for 200 ms. Simultaneously with the letters' appearance, a distracting picture appears in the center of the screen for 200 ms in half of the trials (ITI, inter-trial interval; ms, milliseconds).

Figure 3.  Mean reaction as a function of group and trial type in Experiment 1. The data are collapsed across valid and invalid trials. In the highly fearful group (N = 21), RTs in fear-related picture trials were slower than in neutral picture trials. In the low-fearful group (N = 10), there was no difference in RT between fear-related and neutral pictures. In addition, RTs were slower in picture trials compared with “no-picture” trials in both groups. The error bars depict the SE in each condition; *p < 0.05, **p < 0.001 (ms, milliseconds; RT, reaction time).
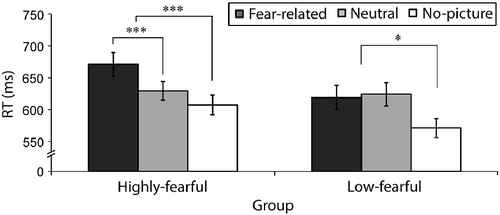
Figure 3.  Mean reaction as a function of group and trial type in Experiment 1. The data are collapsed across valid and invalid trials. In the highly fearful group (N = 21), RTs in fear-related picture trials were slower than in neutral picture trials. In the low-fearful group (N = 10), there was no difference in RT between fear-related and neutral pictures. In addition, RTs were slower in picture trials compared with “no-picture” trials in both groups. The error bars depict the SE in each condition; *p < 0.05, **p < 0.001 (ms, milliseconds; RT, reaction time).

Table I.  Mean reaction times (in milliseconds) and SDs (in brackets, in milliseconds) as a function of group, trial type, and validity in Experiment 1.

Figure 4.  Mean RTs in Experiment 2 as a function of group and trial type. Phobia-related pictures interfered with performance in the highly fearful group (N = 14), resulting in slower RTs in fear-related vs. neutral trials. There were no differences in RT between phobia-related and neutral pictures in the low-fearful group (N = 15). In addition, RTs were slower in picture vs. no-picture trials in both groups, showing that participants perceived the pictures. The error bars depict the SE in each condition; *p < 0.05, ***p < 0.01 (ms, milliseconds; RT, reaction time).
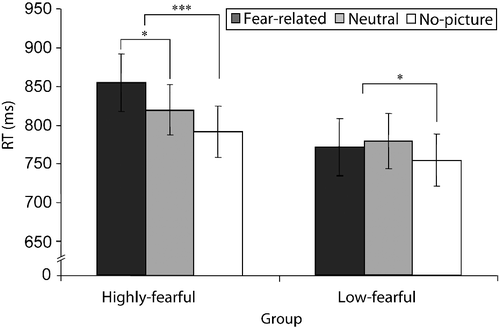
Figure 4.  Mean RTs in Experiment 2 as a function of group and trial type. Phobia-related pictures interfered with performance in the highly fearful group (N = 14), resulting in slower RTs in fear-related vs. neutral trials. There were no differences in RT between phobia-related and neutral pictures in the low-fearful group (N = 15). In addition, RTs were slower in picture vs. no-picture trials in both groups, showing that participants perceived the pictures. The error bars depict the SE in each condition; *p < 0.05, ***p < 0.01 (ms, milliseconds; RT, reaction time).

Figure 5.  Mean RTs in Experiment 2 as a function of group, trial type, and cognitive load. The appearance of phobia-related pictures resulted in slower RTs compared to neutral pictures in the highly fearful group (N = 14), in the low-load condition. There were no differences in RTs between phobia-related and neutral pictures in the low-fearful group (N = 15), in any of the load conditions (all F < 1, ns). In addition, RTs were slower in picture vs. no-picture trials in both groups in low-load conditions. Although the differences in RTs reached significance only in low-load conditions, a similar trend was shown in the other conditions and there were no interactions between load and trial type in each of the groups. The error bars depict the SE in each condition; *p < 0.05, **p < 0.01, ***p < 0.001 (ms, milliseconds; RT, reaction time).
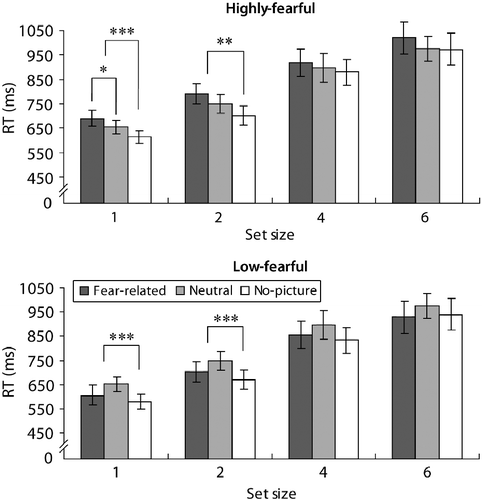
Figure 5.  Mean RTs in Experiment 2 as a function of group, trial type, and cognitive load. The appearance of phobia-related pictures resulted in slower RTs compared to neutral pictures in the highly fearful group (N = 14), in the low-load condition. There were no differences in RTs between phobia-related and neutral pictures in the low-fearful group (N = 15), in any of the load conditions (all F < 1, ns). In addition, RTs were slower in picture vs. no-picture trials in both groups in low-load conditions. Although the differences in RTs reached significance only in low-load conditions, a similar trend was shown in the other conditions and there were no interactions between load and trial type in each of the groups. The error bars depict the SE in each condition; *p < 0.05, **p < 0.01, ***p < 0.001 (ms, milliseconds; RT, reaction time).

Reprints and Corporate Permissions

Please note: Selecting permissions does not provide access to the full text of the article, please see our help page How do I view content?

To request a reprint or corporate permissions for this article, please click on the relevant link below:

Academic Permissions

Please note: Selecting permissions does not provide access to the full text of the article, please see our help page How do I view content?

Obtain permissions instantly via Rightslink by clicking on the button below:

If you are unable to obtain permissions via Rightslink, please complete and submit this Permissions form. For more information, please visit our Permissions help page.