Figures & data
Figure 1. Representative transverse slices showing glucose uptake in the head of rats that chewed a wooden stick during IMO stress (a) without or (b) with the pretreatment injection of botulinum toxin type A into the temporalis muscle (indicated by arrows to the right side). Intensity of SUV is shown in a pseudocolor scaling using MIPAV software package (red-to-blue indicates high-to-low accumulation of glucose, respectively). Note the clear picture of the brain of the chewing rat after blocking of the temporalis muscle in (b).
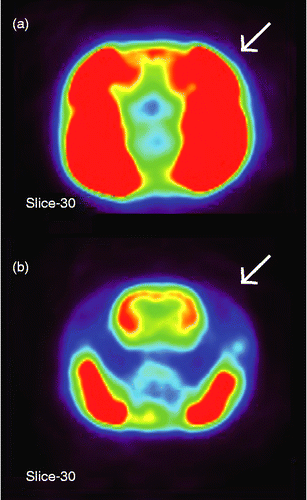
Figure 2. Time-course changes of plasma corticosterone concentration in the rats that were immobilized with (SC) and without (ST) chewing (n = 4 each). Blood was collected from the tail vein three times at 24 h before IMO (Baseline), immediately after IMO for 30 min, and 1 h after the end of IMO. Asterisk indicates a statistically significant difference (P < 0.05) for values obtained at different points in time for the same condition. Dagger indicates a statistically significant difference (P < 0.05) between values obtained for two different conditions at corresponding points in time. The one-way ANOVA test and the post hoc Tukey's multiple comparison with Bonferroni correction were used to determine significant differences.
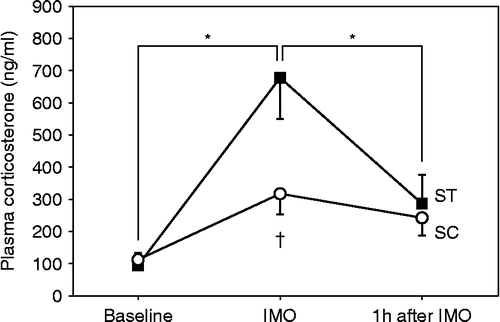
Figure 3. Transverse slices shown from caudal (left) to rostral (right), indicating brain area with significant difference for the relative value of glucose uptake for each pair of conditions. Red and blue color indicate significantly increased and decreased glucose uptake in the former condition compared with that in the latter one, respectively (P values < 0.01; uncorrected). The statistical differences were determined by SPM using a general linear-model approach with proportional normalization and grand mean scaling. Bregma was set to the point of origin in the caudal-rostral axis according to the anatomical atlas of the rat brain (Paxinos and Watson Citation2007). Arrows indicate the position of the hypothalamus. CT, control (no IMO); ST, rats under IMO without chewing; SC, rats under IMO with chewing; n = 6 each.
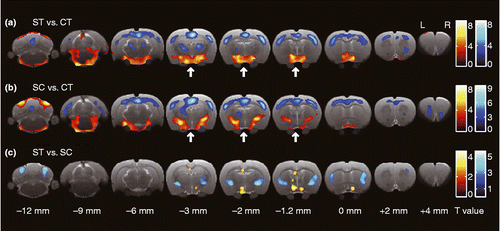
Table I. Ratio of glucose uptake in subregions of the hypothalamus to total glucose uptake in the brain (10− 2%).
Figure 4. Transverse slices shown from caudal (left) to rostral (right), indicating the difference in distribution of relative glucose uptake in the hypothalamus for the three experimental conditions: (a) voxel-based and (b) ROI-based statistical comparisons. CT, control (no IMO); ST, rats under IMO without chewing; SC, rats under IMO with chewing; n = 6 each. AH, anterior hypothalamic area; Arc, arcuate hypothalamic nucleus; DMH, dorsomedial hypothalamic nucleus; PeFLH, perifornical part of lateral hypothalamus; PH, posterior hypothalamic area; PLH, posterior lateral hypothalamus; PVN, paraventricular nucleus; TuLH, tuberal region of lateral hypothalamus; VMH, ventromedial hypothalamic nucleus. Red: significant increase in ST and SC compared with CT. Yellow, significant increase in ST compared with CT; Green, significant difference between each pair of conditions, where ST is the highest and followed by SC and CT; Cyan, significant increase in ST compared with SC and CT. One-way ANOVA and post hoc Tukey's multiple comparison with Bonferroni correction were used to determine statistical differences.
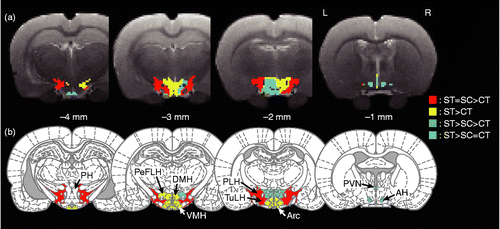
Table II. Effect of paralysis of the temporalis muscle on the regional glucose uptake in the brain.
Table III. Effect of order of three experimental conditions on the regional glucose uptake in the brain.