Publication Cover
Stress
The International Journal on the Biology of Stress
Volume 15, 2012 - Issue 5
219
Views
9
CrossRef citations to date
0
Altmetric
Original Research Reports

Modifications in basal and stress-induced hypothalamic AMP-activated protein kinase (AMPK) activity in rats chronically treated with an angiotensin II receptor blocker

, , , , , , , , , , & show all
Pages 554-561 | Received 07 Apr 2011, Accepted 27 Sep 2011, Published online: 17 Jan 2012

Figures & data

Figure 1.  Effects of restraint stress and surgical stress upon plasma glucose concentrations in rats treated with candesartan for 2 weeks. **p < 0.01 compared to control; p < 0.05, p < 0.01 compared to candesartan; p < 0.01 compared to control+restraint stress; p < 0.01 compared to candesartan+restraint stress. Data are expressed as mean ± SEM; n = 7–9 for each group. ANOVA followed by Bonferroni test.
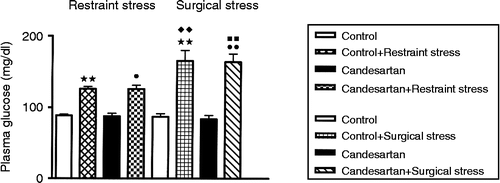
Figure 1.  Effects of restraint stress and surgical stress upon plasma glucose concentrations in rats treated with candesartan for 2 weeks. **p < 0.01 compared to control; p < 0.05, p < 0.01 compared to candesartan; p < 0.01 compared to control+restraint stress; p < 0.01 compared to candesartan+restraint stress. Data are expressed as mean ± SEM; n = 7–9 for each group. ANOVA followed by Bonferroni test.

Figure 2.  Hypothalamic AMPK activity at baseline and after restraint and surgical stress in rats treated with candesartan for 2 weeks. *p < 0.05, **p < 0.01 compared to control; p < 0.05, p < 0.01 compared to candesartan; p < 0.01 compared to control+restraint stress; p < 0.01 compared to candesartan+restraint stress. Data are expressed as mean ± SEM; n = 7–9 for each group. Kruskal–Wallis test followed by Conover-Inman comparison.
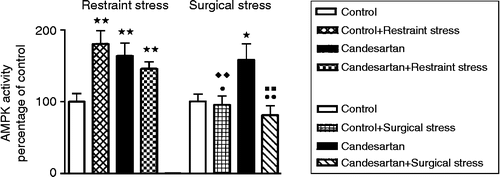
Figure 2.  Hypothalamic AMPK activity at baseline and after restraint and surgical stress in rats treated with candesartan for 2 weeks. *p < 0.05, **p < 0.01 compared to control; p < 0.05, p < 0.01 compared to candesartan; p < 0.01 compared to control+restraint stress; p < 0.01 compared to candesartan+restraint stress. Data are expressed as mean ± SEM; n = 7–9 for each group. Kruskal–Wallis test followed by Conover-Inman comparison.

Reprints and Corporate Permissions

Please note: Selecting permissions does not provide access to the full text of the article, please see our help page How do I view content?

To request a reprint or corporate permissions for this article, please click on the relevant link below:

Academic Permissions

Please note: Selecting permissions does not provide access to the full text of the article, please see our help page How do I view content?

Obtain permissions instantly via Rightslink by clicking on the button below:

If you are unable to obtain permissions via Rightslink, please complete and submit this Permissions form. For more information, please visit our Permissions help page.