Figures & data
Figure 1. Effect of CMS on sucrose index, calculated as a ratio between weekly sucrose intake and baseline values of sucrose consumption measured before the onset of stress. The CMS protocol was applied during 8 weeks and animals were divided into resilient (Res, n = 4), anhedonic-like (Anh, n = 5), and intermediate (IM, n = 11) groups according to their hedonic status evaluated by averaged SI calculated throughout the experiment. Gray bars indicate periods of time of fecal sampling. Animals in Anh and IM groups had a significantly lower SI during the entire experiment confirmed by ANOVA and Dunnett's post hoc comparison. Data are shown as mean ± SEM, ***p < 0.001; *p < 0.05 between groups during the time course of the experiment.
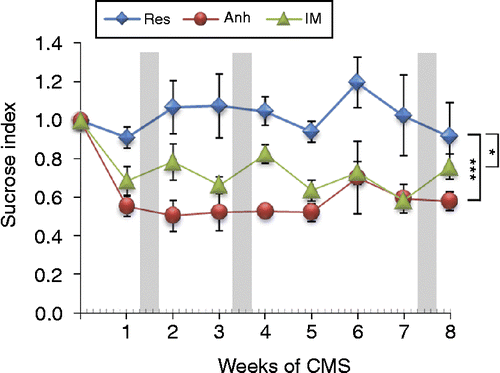
Figure 2. FCM measured with the 5α-pregnane-3β,11β,21-triol-20-one EIA in a random group (n = 8) before CMS. Animals were adapted to the grid floor during 3 days before fecal sampling. To control the effect of injection on diurnal rhythm, the sterile saline solution was injected (1 ml/rat) at 9:00 on Day 1 (as indicated). Data are given as box plots (showing medians by lines in boxes), 25% and 75% (boxes), and 10% and 90% (whiskers). Dark background corresponds to diurnal variation 24 h prior to the saline injection, lighter background indicates Day 1 after saline injection. The dark phase (horizontal bar) is indicated at the top of the panel.
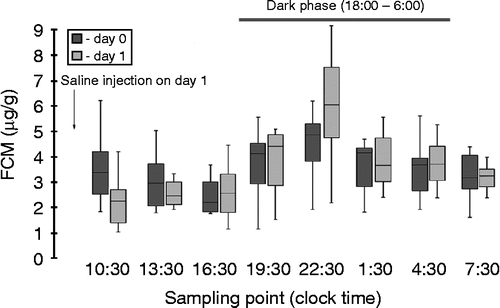
Figure 3. Histograms of frequency distribution for animals exposed to 8-week CMS and divided by the groups according to their hedonic status: anhedonic-like (Anh, n = 5), stress resilient (Res, n = 4), and intermediate (IM, n = 11) for FCM peak (upper panel) and FCM nadir (lower panel) concentrations by week 2 (left column), week 4 (middle column), and week 8 (right column) of CMS.
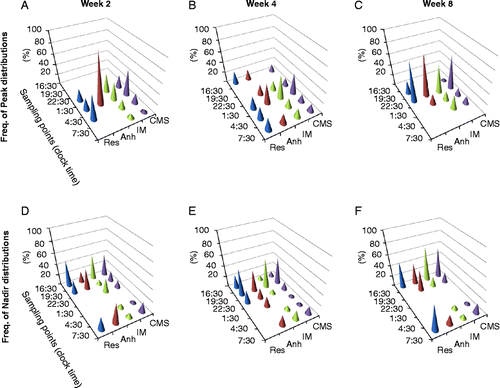
Table I. FCM concentrations for peak, nadir and their differences (Delta) in CMS groups during the 8-week CMS protocol.
Figure 4. Diurnal FCM distribution at different time points during CMS and effect of DST. FCM measured with the 5α-pregnane-3β,11β,21-triol-20-one EIA in rats from resilient (Res; n = 4), anhedonic-like (Anh; n = 5), and intermediate (IM; n = 11) by week 2 (A), week 4 (B), and week 8 (C) of CMS. Data for the measurements from all CMS animals are given as box plots (showing medians by lines in boxes), 25% and 75% (boxes), and 10% and 90% (whiskers). Diamonds, circles, and triangles indicate medians for FCM distribution in the resilient, anhedonic-like, and intermediate groups, respectively. 1 mg/kg of dexamethasone (Dex) was injected at 9:00 on Day 1 as indicated by the arrow. The dark phase (horizontal bar) is indicated at the top of the panel. Statistical differences between the three groups were analyzed using KW test following Dunn's post comparison. *p < 0.05 Anh vs. Res.
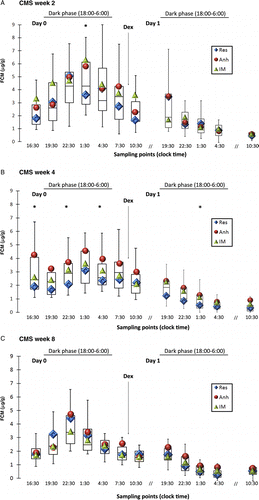
Table II. AUC for individual FCM measures in CMS groups.
Table III. Efficiency of DST calculated as a difference in FCM before and after dexamethasone injection at selected sampling points.