Figures & data
Table I. Sample description.
Figure 1. Mean total plasma cortisol concentration response ( ± SEM) to injection of 1 μg ACTH1–24 in subjects with high vs. low EE. For illustration reasons, the sample was artificially divided by median split into groups with high (N = 27) vs. low (N = 26) EE; statistics are based on continuous EE questionnaire scores; the figure presents untransformed raw values. ANCOVA analysis for repeated measures controlling for sex, BMI, and CBG concentrations revealed that higher EE (entered as continuous variable) was associated with higher concentrations of total plasma cortisol in response to the ACTH1–24 injection (p = 0.045).
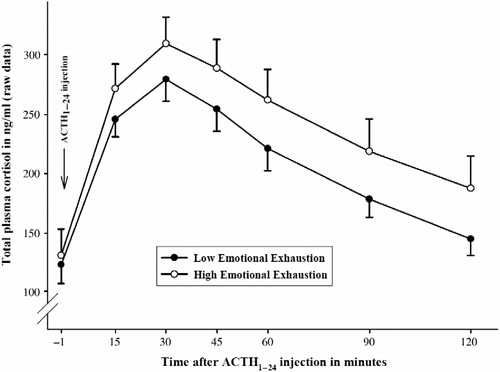
Figure 2. Mean ACTH (A), total plasma cortisol (B), and free salivary cortisol (C) concentration responses ( ± SEM) to injection of 100 μg CRH in subjects with high vs. low OC to work. Note: For illustration reasons, the sample was artificially divided by median split into groups with high (N = 26) vs. low (N = 27) OC; statistics are based on continuous OC questionnaire scores; the figures present untransformed raw values. ANCOVA analyses for repeated measures controlling for sex, BMI, and CBG concentrations revealed that higher OC (entered as continuous variable) was associated with lower concentrations of ACTH (p = 0.045), total plasma cortisol (p = 0.005), and free salivary cortisol (p = 0.023) in response to the CRH injection.
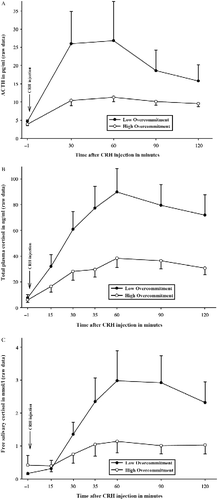
Table II. Pearson correlation matrix for MBI-EE, OC, and HADS-D.