Figures & data
Figure 1. Diagram of the experimental design. 5αR1, steroid 5α-reductase isoform 1; 5αR2, steroid 5α-reductase isoform 2; GD, gestational day; PND, postnatal day; RT-qPCR, quantitative real time reverse transcription polymerase chain reaction.
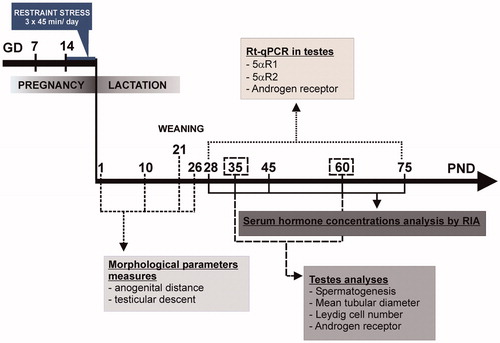
Table 1. Characteristic of oligonucleotide primers and amplified products of real-time PCR.
Figure 2. Effect of prenatal stress on the sexual development landmarks of male pups. C, control; PS, prenatal stress; PND, postnatal day. (A) Values represent the mean anogenital distance ± SEM. Groups with no letters in common are significantly different (two-way ANOVA followed by main effects analyses: p < 0.001 for prenatal treatment factor effects; p < 0.001 for age factor effects; n = 7). (B) Values represent the mean percentage ± SEM of rats per litter in which both testes descended into the scrotal sac. Groups with no letters in common are significantly different (Repeated measures ANOVA followed by simple effects ANOVA analyses: p < 0.05 for C versus PS rats at PND 21; p < 0.001 for C versus PS rats at PND 23; p < 0.001 for C versus PS rats at PND 24; p < 0.001 for age factor effect in C group and p < 0.001 forage factor in PS group; n = 4–5 litters per treatment).
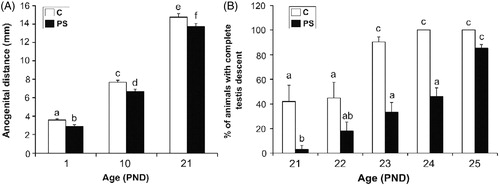
Figure 3. Effect of prenatal stress on serum concentrations of pituitary and testicular hormones. C, control; PS, prenatal stress; PND, postnatal day. Values represent the mean ± SEM serum concentrations of: (A) follicle stimulating hormone (FSH) (Kruskal–Wallis followed by Mann–Whitney U test: p < 0.01 for C versus PS rats at PND 28; p < 0.01 for differences among ages in C group; n = 5–9); (B) luteinizing hormone (LH) (two-way ANOVA followed by simple effects ANOVA analyses: p < 0.001 for C versus PS rats at PND 28; p < 0.01 for C versus PS rats at PND 75; p < 0.001 for age factor effect in PS group; n = 5–9); (C) testosterone + dihydrotestosterone (T + DHT) (two-way ANOVA followed by main effects analysis: p < 0.001 for prenatal treatment factor effects; p < 0.001 for age factor effects; n = 5); (D) specific testosterone (two-way ANOVA followed by simple effects ANOVA analyses: p < 0.001 for C versus PS rats at PND 75; p < 0.001 for age factor effects in C group; p, 0.001 for age factor effects in PS group; p = 5–7). (E) 5α-androstane-3α-17β diol (Diol) (two-way ANOVA followed by simple effects ANOVA analyses: p < 0.001 for C versus PS rats at PND 28; p < 0.001 for C versus PS rats at PND 45; p < 0.001 for age factor effects in C group; p < 0.001 for age factor effects in PS group; n = 5–9). In all cases, the significant differences between groups are indicated with different letters.
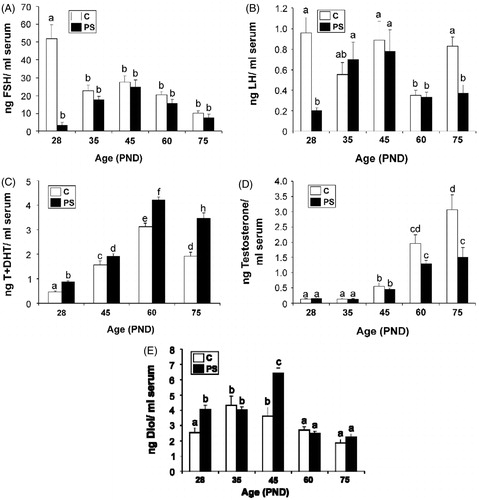
Figure 4. Effect of prenatal stress on the testicular steroid 5α-reductase isoform 1 (A) and 2 (B) mRNA expression in 28- and 75-day-old rats. C, control; PS, prenatal stress; PND, postnatal day. The mRNA levels determined by real-time PCR are expressed relative to the housekeeping gene beta-2 microglobulin mRNA expression as arbitrary units and as % of PND 28 control rats. Values are reported as mean ± SEM and different letters depict significant differences between groups (two-way ANOVA followed by simple effects ANOVA analyses: p < 0.001 for C versus PS rats at PND 28; p < 0.01 for age factor effects in C group; p < 0.001 for age factor effects in PS group; n = 4–5).
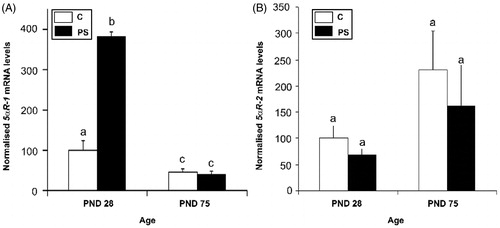
Figure 5. Effect of prenatal stress on testicular histology of offspring. C, control; PS, prenatal stress. (A), (B)–(D), (E) Images of histological sections showing seminiferous tubules at different stages of spermatogenesis development in postnatal day (PND) 35 rats belonging to C (A) or PS (B) groups or in PND 60 rats belonging to C (D) or PS (E) experimental groups. Scale bar = 50 mm. Arrows show the last stage of maturation of the germinal epithelium. (C–F) Testes were evaluated histologically for the quality ofspermatogenesis according to the Johnsen score based on number and furthest maturation stage present, with a score of ‘10' being optimal with normal numbers of spermatozoa present and a score of ‘1' representing total absence of germ cells and Sertoli cells (Lewis-Jones & Kerrigan, Citation1985). Values are reported as mean ± SEM. Asterisks show the presence of differences in Johnsen's scores between C and PS rats on PND 35 (Kruskal–Wallis test: ***p < 0.001; n = 4) or PND 60 (Kruskal–Wallis test: ***p < 0.001; n = 4). (G) Mean tubular diameter of seminiferous tubules of PND 35 or PND 60 C and PS rats. Values are reported as mean ± SEM. Asterisks show differences in tubular diameter between C animals and PS rats in PND 35 rats (Student t-test: ***p < 0.001; n = 4).
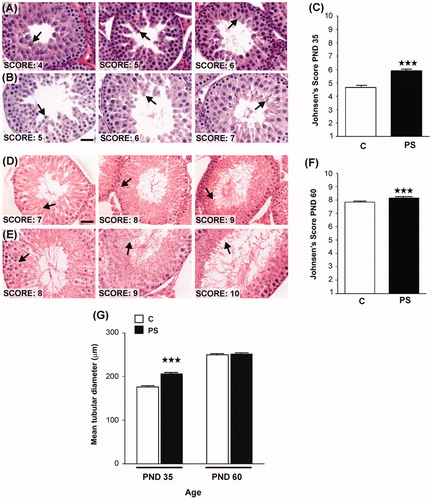
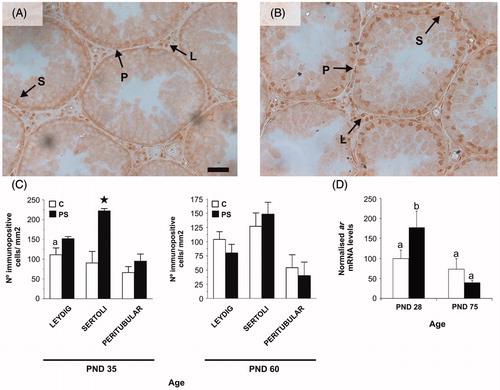
Figure 6. Effect of prenatal stress on androgen receptor (AR) immunoreactivity (A, B and C) and mRNA levels (D) in rat testes. C, control; PS, prenatal stress; PND, postnatal day. Micrograph shows an example ofAR immunohistochemistry in testes at PND 35 in the (A) or PS (B) groups. Arrows shows positive immunoexpression ofthe AR in Leydig (L), Sertoli (S) and peritubular myoid (P) cells. Scale bar = 50 mm. (C) Number of immunopositive Sertoli, Leydig or peritubular cells per mm2 of testis for PND 35 and 60 rats. Values are mean ± SEM. Symbols represent significant differences between C and PS 35-day-old rats (Student t-test: a,*p < 0.05; n = 4–5). (D) ar mRNA levels in testes are mean ± SEM values, relative to expression of the housekeeping gene beta-2 microglobulin in arbitrary units and as % of PND 28 control rats. Different letters indicate significant differences between groups (two-way ANOVA followed by simple effects ANOVA analyses: p < 0.05 for C versus PS rats at PND 28; p < 0.001 for age factor effects in PS group; n = 4–5).