Figures & data
Figure 1. Time line of the testing session. The cortisol measurements are marked as C0–C6, and times in minutes from entry into the laboratory are indicated.
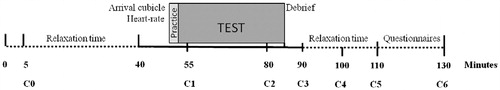
Figure 2. Set up computer screen for the SEST. The photograph is derived from the Radboud Faces Database (Langner et al., Citation2010) and is not of a participant. The position of the photograph on the right changed from the green zone to the red zone during the test. Top left is the alarm light, activated twice during the test.
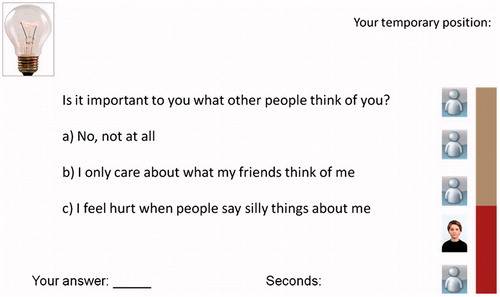
Table 1. Descriptive statistics and possible confounders of the sample (N = 52).
Figure 3. Salivary cortisol concentrations (means ± SEM) over the stress paradigm: pre-stress concentration (lowest of samples 1 and 2), stress concentration (highest of samples 3, 4, and 5), and recovery concentration (sample 6) for the group as a whole (N = 52), for boys (N = 23) and for girls (N = 29). Paired samples t-tests were used to examine the differences between pre-stress level, stress level and recovery level. ***p < 0.001, †p = 0.07.
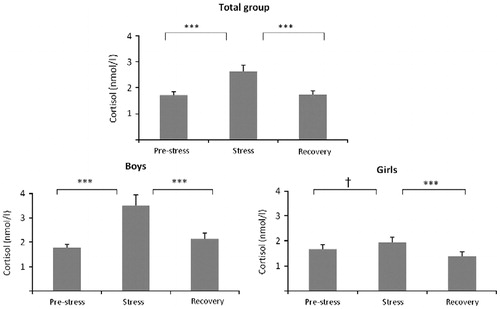
Figure 4. Salivary cortisol concentrations (means ± SEM) over the social evaluative stress paradigm (SEST) for boys (N = 23; mean increase in cortisol = 163%), and girls (N = 29; mean increase in cortisol = 44%). The gray box indicates the stress phase. Independent samples t-tests were used to examine the difference in the six cortisol measurements between boys and girls. **p < 0.001, *p < 0.05.
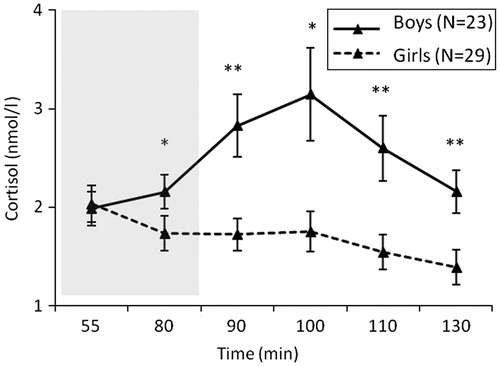
Figure 5. Salivary cortisol concentrations (means ± SEM) over the social evaluative stress paradigm (SEST) for 10- to 12-year-olds (N = 32; mean increase in cortisol = 79.8%), and 13- to 15-year-olds (N = 20; mean increase in cortisol = 30.2%). The gray box indicates the stress phase. Independent samples t-tests were used to examine the difference in the six cortisol measurements between age groups. †1p = 0.06, †2p = 0.08.
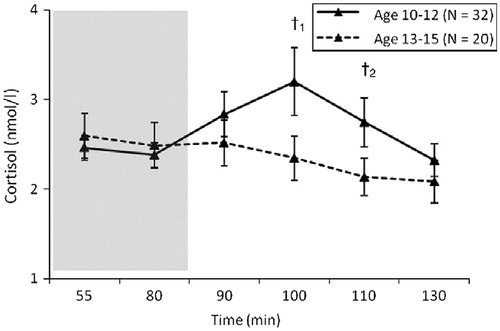
Table 2. Correlations between the actual increase in cortisol concentration and potential confounders for the total group (N = 52), boys (N = 23), and girls (N = 29).