Figures & data
Figure 1. Procedure used in the Encoding condition (lasting 1500 ms) and the Encoding During Maintenance condition (entire 2500 ms). In the Encoding During Maintenance condition, participants were tested on the two-item array on 50% of the trials to measure maintenance, and the three-item array on 50% of the trials to measure encoding. This figure is redrawn from Woodman & Vogel (Citation2005).
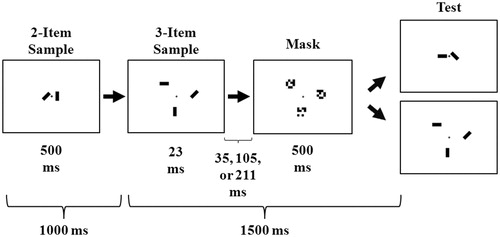
Table 1. Mean values of all stress measures at T1 and T2 assessments.
Figure 2. Participants’ change in performance from T1 to T2 in the Encoding condition as a function of their change in log10 salivary cortisol concentration between T1 and T2. R2 is reported (n = 33), p = 0.065.
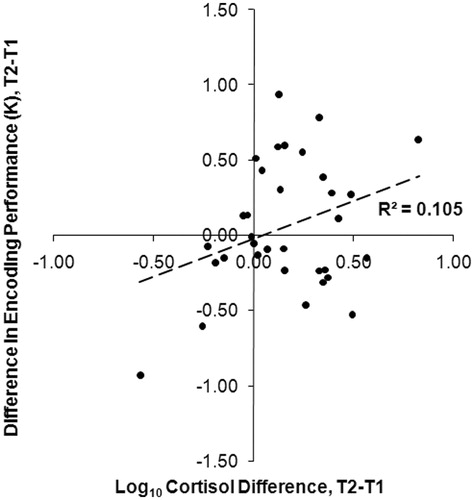
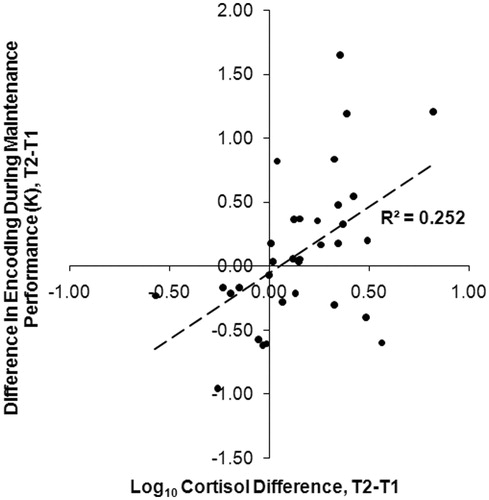
Figure 3. Participants’ change in performance from T1 to T2 in the Encoding During Maintenance condition as a function of their change in log10 salivary cortisol concentration between T1 and T2. R2 is reported (n = 33), p = 0.003.
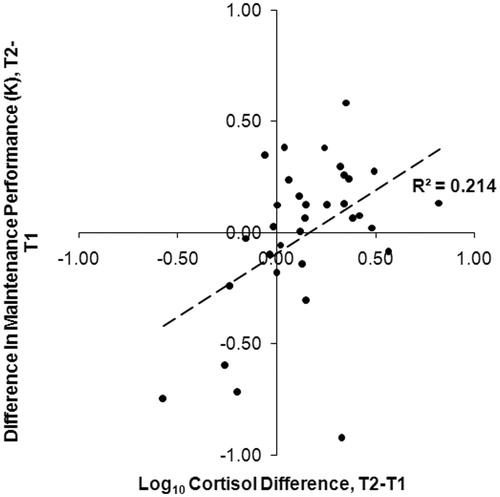
Figure 4. Participants’ change in performance from T1 to T2 in the Maintenance condition as a function of their change in log10 salivary cortisol concentration between T1 and T2. R2 is reported (n = 33), p = 0.007.