Figures & data
Figure 1. Primers and conditions used for methylation analysis by MS-PCR. (A) List of primers for the methylated and unmethylated alleles and thermal conditions used for methylation analysis by MS-PCR. MF and MR, forward and reverse primers specific to bisulfite converted methylated DNA; UF and UR, forward and reverse primers specific to bisulfite converted unmethylated DNA; U/M R, reverse primer specific to bisulfite converted unmethylated and methylated DNA. (B) Schematic representation of HERV-K primers designed. In relation to the transcriptional start site of HERV-K10, primers are complementary to the following positions: HERV-K10-UF, 959–983 bp; HERV-K10-MF, 958–983 bp; HERV-K10-UR and HERV-K10-MR, 1036–1060 bp. HERV-K10 NCBI accession number is indicated in parenthesis.
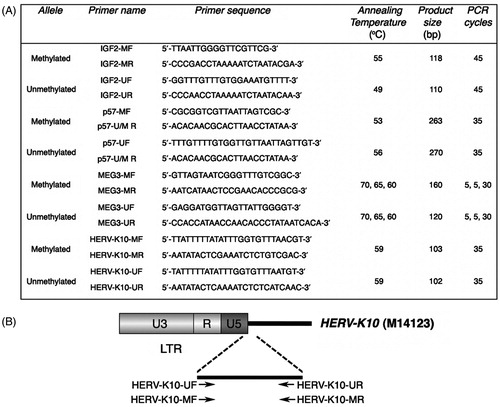
Table 1. Methylation analysis of HERV-K among PGD and control samples.
Table 2. Methylation analysis of (A) DLK1/MEG3, (B) p57KIP2 and (C) IGF2/H19 DMRs among PGD and control samples.
Table 3. Total results of methylation analyses performed in PGD samples.
Figure 2. Abundance in transposable element sequences within DLK1/MEG3. IGF2/H19 and p57KIP2 imprinted loci. Histograms indicate the percentage coverage in SINE, LINE, LTR retrotransposon, DNA transposon as well as the total one in transposable element sequences within (A) DLK1/MEG3, (B) IGF2/H19 and (C) p57KIP2 imprinted loci. The tables, below each histogram, show the percentage values of the coverage of SINE, LINE, LTR retrotransposon, DNA transposon and total transposable element sequences within the aforementioned regions.
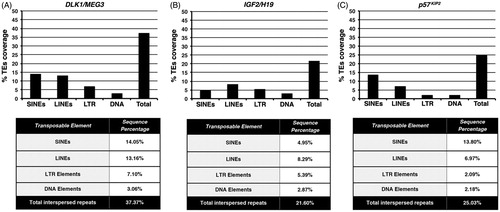
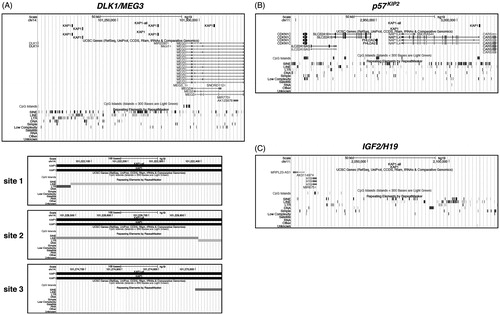
Figure 3. Bioinformatic analysis for KAP1-binding sites within DLK1/MEG3. p57KIP2 and IGF2/H19 loci. KAP1-binding sites were viewed and analyzed in the UCSC Genome Browser. (A) The snapshot, in the upper part, shows in the first track the data from the analysis for KAP1-binding sites within DLK1/MEG3 locus. KAP1-all denotes the total KAP1-binding sites found, while KAP1 the retrotransposon-associated KAP1-binding sites, respectively. The next two tracks show the genes and the CpG islands contained in the genomic region, respectively. The Repeating Elements cluster shown in the last track summarizes the set of transposable element sequences from RepeatMasker. In the lower part, the snapshots, named site 1, 2 and 3, indicate the individual retrotransposon-associated KAP1-binding sites within DLK1/MEG3 locus. (B, C) The snapshots show the data from the respective analyses for p57KIP2 and IGF2/H19 loci, respectively.