Figures & data
Figure 1. Body weight gain in stress-naive (control) rats and rats chronically exposed to forced swim at 25 °C (swim25) or 36 °C (swim36). A GzLM was used. Group mean +/− s.e.m. (n = 10 for each group) body weight gain over the 13 days of treatment are represented. Groups labelled with different symbols are statistically different (at least p < 0.05 after sequential Bonferroni post-hoc).
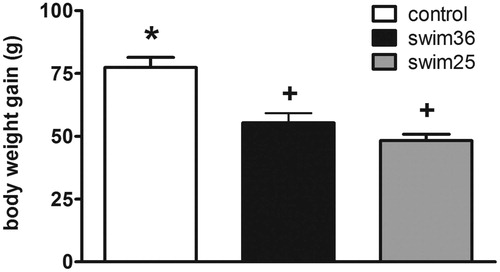
Figure 2. Plasma concentrations of ACTH (A) and corticosterone (B) for rats exposed to forced swim at 36 °C (swim36, black bars) or 25 °C (swim25, grey bars). A GEE model was used. Group mean +/− s.e.m. (n = 10 for each group) are represented. Samples were taken immediately after the stressor (S) and at 30 min post-stress (R30) on days 1, 2, 4 and 13. Horizontal lines indicate average resting concentration of ACTH and corticosterone measured in an additional control group. In all cases, one symbol indicates p < 0.05, two symbols p < 0.01, three symbols p < 0.001; * denotes significant difference with respect to day 1 (ACTH) and to the corresponding sampling time on day 1 (corticosterone); Δ denotes significant difference with respect to the preceding day (ACTH) and to the corresponding sampling time on the preceding day (corticosterone); and # denotes significant differences between the two swim groups (swim 25 and swim36) on the same day and at the same sampling time.
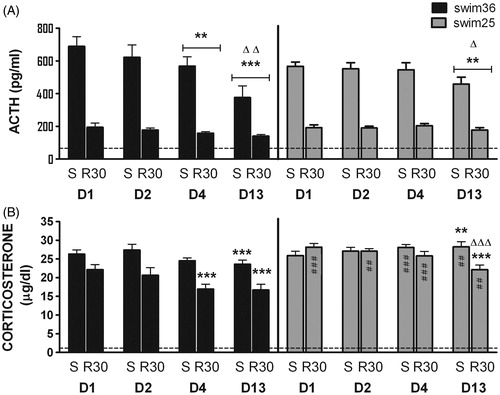
Figure 3. Effects of chronic swim exposure at 25 °C (solid line) or 36 °C (dotted line) on struggling (A), immobility (B) and mild swim (C) on days 1, 2, 4 and 13. Behavior was only analyzed during the first 5 min of daily exposure, using a GEE model. Data are expressed as group mean +/− s.e.m. (n = 10 each group). Two symbols indicate p < 0.01 and three symbols p < 0.001. * denotes significant difference with respect to day 1 within the same group. Differences between groups are all significant with exception of struggling on days 4 and 13.
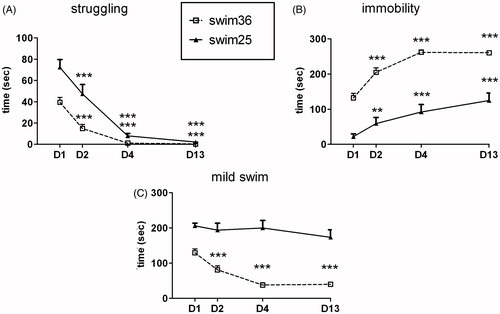
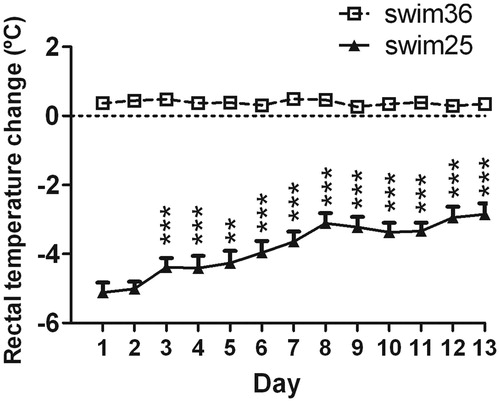
Figure 4. Effects of chronic exposure to swim at 25 °C (solid line) on rectal temperature (RT), changes with respect to pre-swim values from day 1 to 13. A GEE was used. Data are expressed as group mean +/− s.e.m. (n = 10 each group). Two symbols indicate p < 0.01, three symbols p < 0.001. * denotes differences in RT versus day 1 (rats swimming at 36 °C are not included in the statistical analysis). The statistical analysis revealed an effect of days, indicating a progressive reduction of hypothermia over the days.