Figures & data
Table 1. Descriptive statistics by group: mean (SD).
Table 2. Mean cortisol values over two days by group: mean (SE) nmol/L.
Figure 1. Mean awakening cortisol levels over two days in high-stress exam (n = 24), low-stress exam (n = 18) and nonexam (n = 21) groups. The x-axis represnets time points of saliva sampling, and the y-axis represent averaged raw cortisol levels across two days. Error bars represent the standard error of the mean.
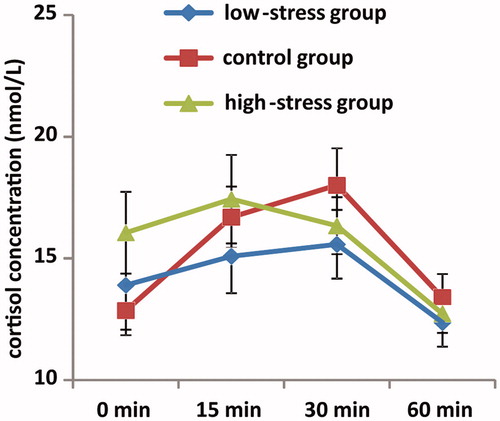
Figure 2. Values of four different CAR measures over two days in the high-stress exam group (n = 24), low-stress exam group (n = 18) and nonexam group (n = 21). The graph shows mean value, with error bars representing the standard error of the mean. *p < 0.05; **p < 0.01.
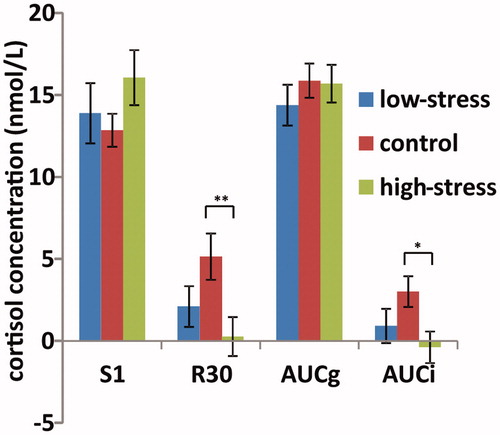
Table 3. Bivariate correlations.