Figures & data
Figure 1. Abnormal sensitivity of the humoral and neural stress systems in NCAM−/− mice. (A) NCAM−/− mice (white bars; n = 13) tend to have higher plasma corticosterone levels at baseline compared to NCAM+/+ mice (black bars; n = 9). Mice of both genotypes have increased plasma corticosterone levels after both stressor 1 (rectal temperature measurement; n = 12 NCAM−/− and 10 NCAM+/+) and stressor 2 (tail suspension; n = each 6 per genotype). However, NCAM−/− mice present with significantly higher stress-induced corticosterone levels than NCAM+/+ mice. (B) NCAM−/− mice (n = 13) show a hypertrophy and increased weight of adrenal glands, compared to NCAM+/+ mice (n = 12). (C) Glucocorticoid receptor (GR) mRNA expression in the hippocampus of NCAM−/− mice (n = 8) is reduced when compared to NCAM+/+ mice (n = 9). These changes are indicative of a chronic hyperactivity of the HPA axis in NCAM−/− mice. Values indicate group means ± SEM; *, ** p ≤ 0.05, 0.01, respectively, compared to NCAM+/+.
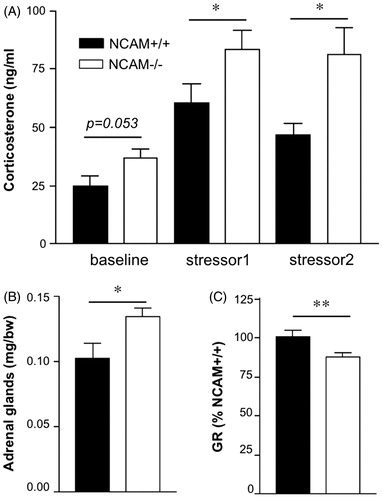
Figure 2. 8-OH-DPAT induced hypothermia. The hypothermic response to doses of 1.0 or 2.0 mg/kg of 8-OH-DPAT is reduced in NCAM−/− mice (n = 10 and 14, respectively), compared to NCAM+/+ mice (n = 8, 11). No significant difference between genotypes is seen at lower doses (n = 12 NCAM−/− versus 11 NCAM+/+ for saline, 9 versus 9 for 0.01 mg/kg and 13 versus 10 for 0.5 mg/kg). These data indicate a desensitization of 5-HT1A autoreceptors in the dorsal Raphe nucleus. Values indicate group means ± SEM; **, *** p ≤ 0.01, 0.001, respectively, compared to NCAM+/+.
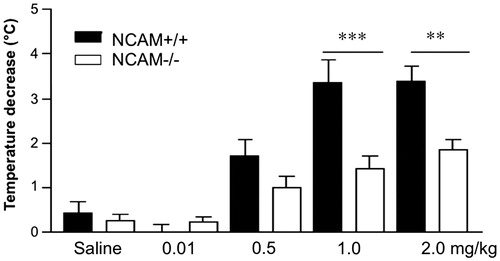
Figure 3. Increased arousal and novelty response in NCAM−/− mice. (A) NCAM−/− mice (n = 18) show higher locomotor activity and reduced wall-supported rearing in comparison to NCAM+/+ mice (n = 18) in an open field. (B) Increased locomotor activity and increased number of entries to the dark are evident in a light/dark test of anxiety. (C) In the elevated plus maze, NCAM−/− mice show a remarkable increase in open arm exploration, but no change in closed arm exploration. (D) NCAM−/− mice in the new cage/new object test show increased rearing on both test days, indicating an enhanced novelty response. Values indicate group means ± SEM; *, **, *** p ≤ 0.05, 0.01, 0.001, respectively, compared to NCAM+/+. ## p ≤ 0.01 compared to NCAM+/+ mice on day 1.
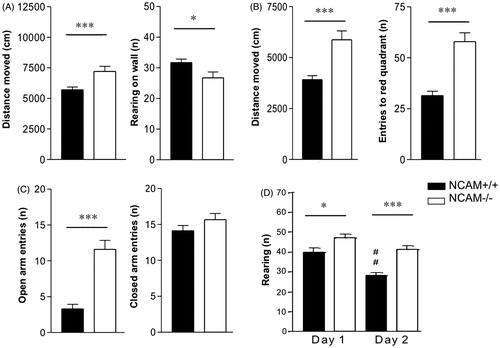
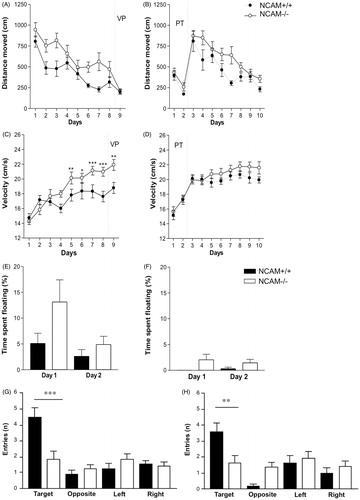
Figure 4. Pre-training in NCAM−/− mice improves emotional, but not cognitive parameters in a Morris water maze task. (A,C,E,G) NCAM−/− mice (white dots/bars, n = 12) without pre-training (VP) show delayed acquisition (p ≤ 0.001) (A) and reduced long-term memory (G) accompanied by increased signs of stress and arousal, for instance floating behavior during the first training day and increased swimming velocity during later stages of the learning process as compared to NCAM+/+ mice (black rhomb/bars; n = 11). (B,D,F,H) Pre-training (PT) reduces the emotional response of floating in both genotypes, but does not ameliorate the deficit in learning (B; p ≤ 0.01) or long-term memory of the spatial task (NCAM−/−, n = 14; NCAM+/+, n = 11). Moreover, swim speed is similarly high in both genotypes. Values indicate group mean values ± SEM; *, **, *** p ≤ 0.05, 0.01, 0.001, compared to NCAM+/+.