
Figures & data
Table 1. Chronic unpredictable mild stress protocol (Moreau et al., 1994).
Figure 1. Daily food intake (mean ± sem; n = 10 rats/group) by rats submitted (CUMS) or not (control) to chronic unpredictable mild stress and given access to commercial chow only (CC). Note: On day 0, rats were not submitted to CUMS (the day before the stress protocol), on days 2 and 9, rats submitted to CUMS had access to food and water for only 12 h and restricted access for an additional 2 hours. On days 3 and 10, rats submitted to CUMS had access to water for only 12 h. *p < 0.05 versus controls (two-way ANOVA with Bonferroni test).
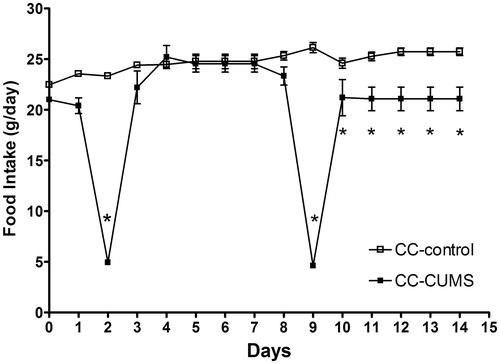
Figure 2. Daily intake of commercial chow (CC) and comfort food (CF) shown separately for the control group and for the chronic unpredictable mild stress group (CUMS) given the combined food choice. Hence, total daily food intake (not shown) for the control and CUMS groups can be interpolated by summing daily CC and CF intakes for each group. Data are mean ± sem, n = 10 rats/group. On day 0, rats were not submitted to CUMS (the day before the stress protocol); on days 2 and 9, rats submitted to CUMS had access to food and water for only 12 h and restrict access for an additional 2 hours. On days 3 and 10, rats submitted to CUMS had access to water for only 12 h. *p < 0.05 versus controls (two-way ANOVA with Bonferroni test).’.
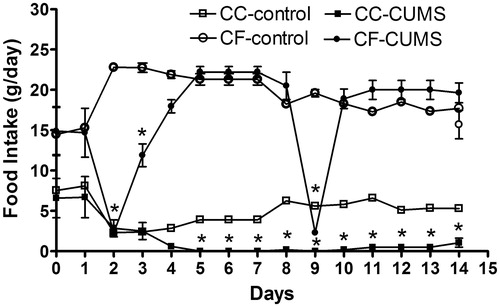
Table 2. Daily food and caloric intake, initial body weight and body weight gain by rats submitted (CUMS) or not (control) to chronic unpredictable mild stress and given access either to commercial chow (CC) only or to commercial chow and comfort food (CC/CF).
Figure 3. Percentage of entries into (A) and time spent in (B) the open and closed arms of the elevated plus-maze by rats submitted (CUMS) or not (control) to chronic unpredictable mild stress and given access either to commercial chow (CC) only or to commercial chow (CC) and comfort food (CF). (n = 10 rats/group). *p < 0.05, stress effect; **p < 0.05, diet effect (two-way ANOVA followed by Bonferroni test).
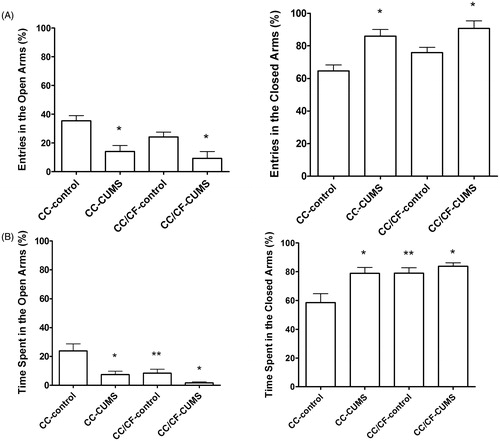
Table 3. Behavior in the open field test of rats submitted (CUMS) or not (control) to chronic unpredictable mild stress and given access either to commercial chow only (CC) or to commercial chow and comfort food (CC/CF).
Figure 4. Serum corticosterone concentration (mean ± sem) by rats submitted (CUMS) or not (control) to chronic unpredictable mild stress and given access either to commercial chow (CC) only or to commercial chow (CC) and comfort food (CF). CC-control group: n = 8 rats/group; CC-CUMS group: n = 5 rats/group; CC/CF-control group: n = 8 rats/group; CC/CF-CUMS group: n = 4 rats/group. *p < 0.05, stress effect; **p < 0.05, interaction between stress and diet effects (two-way ANOVA with Bonferroni test).
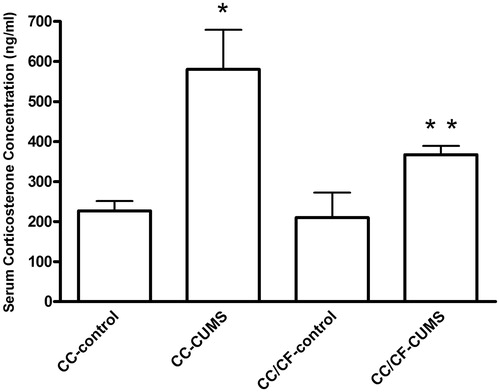
Table 4. Serum concentrations of glucose, total cholesterol and triglycerides of rats submitted (CUMS) or not (control) to chronic unpredictable mild stress and given access either to commercial chow (CC) only or to commercial chow and comfort food (CC/CF).