
Figures & data
Figure 1. Cortisol and sAA responses to the stressor. Duration of the stressor is indicated with the dark gray bars.
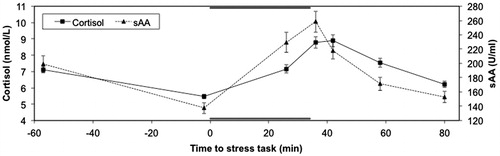
Table 1. Descriptives for the study variables.
Table 2. Correlations between the arrival index, stress index, AUCg and AUCi, separately for cortisol (above the diagonal) and sAA (below the diagonal).
Table 3. Correlations between the cortisol and sAA arrival indices, and personality and emotion regulation variables.