
Figures & data
Figure 1. Effect of early maternal separation and variable chronic stress on the total volume (in mm3, mean ± SE) of the dorsal hippocampus. The number of animals for each treatment is included inside each bar.
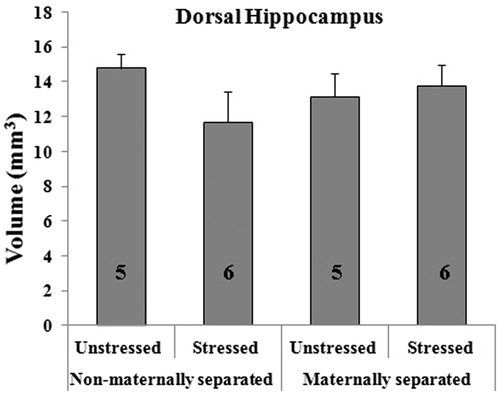
Figure 2. Effect of early maternal separation and variable chronic stress on the volume (in mm3, mean ± SE) of the CA1 (A), CA2/CA3 (B) and DG (C) areas of the dorsal hippocampus and their respective strata (D–F). The number of animals for each treatment is included inside each bar.
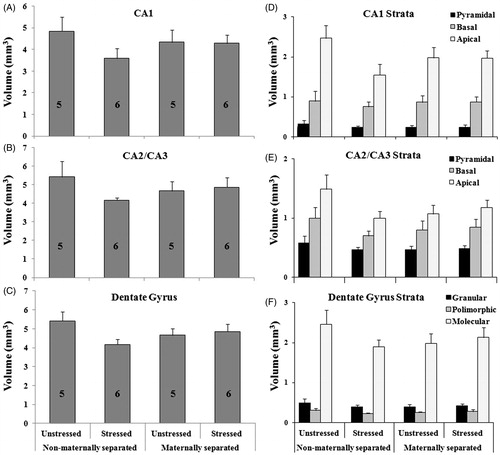
Figure 3. Effect of early maternal separation and variable chronic stress on freezing behavior recorded on the first day of the test, during the conditioning and post-conditioning stages (A) and during memory retrieval 24 h after conditioning (B). Values represent the percentage time of freezing (mean ± SE) for animals tested in the same context. The number of cases for each treatment is included inside each bar. (*) Means significant difference between groups (p < 0.05). Post hoc analysis showed significant difference between NMS-CVS and controls (NMS-NCVS) and MS-CVS during post-conditioning (A) and between NMS-CVS and controls (NMS-NCVS) during memory retrieval (B).
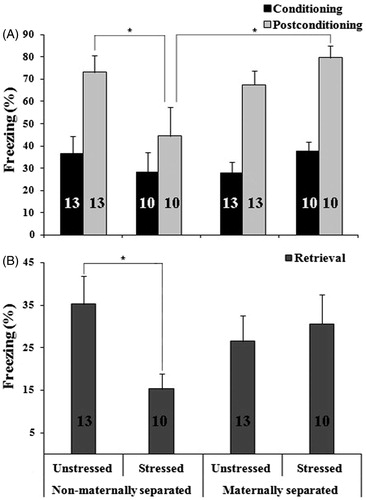
Table 1. Results of the two-way ANOVA analysis from dorsal hippocampal, its areas and strata volumes.