Figures & data
Figure 1. Effects of restraint stress on plasma CORT secretion on E3, E5, and E7 pregnant mice. The data (ng/mL) were expressed as the mean ± SD. Uppercase letters represented the differences among E3, E5, and E7 in the control group (p < 0.05), and lowercase letters represented the differences among E3, E5, and E7 in the stressed group (p < 0.05). *p < 0.05 and #p < 0.01 were used to denote significance compared with the corresponding control groups.
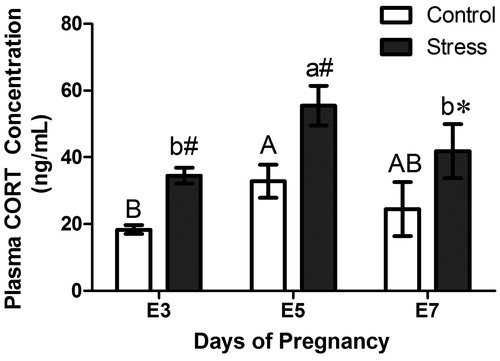
Figure 2. Effects of restraint stress on the number of implantation sites on E3, E5, and E7 pregnant mice. There were no implantation sites on E3, while on E5, implantation sites were detected as round or oval embryos that were stained blue by 0.5% trypan blue. As expected, the implantation sites were larger and arranged as a string of beads in the uterus. Scale bars = 1 cm. The short arrows show the implantation sites on E5 and E7. Values were expressed as the mean ± SD. #p < 0.01 versus the E7 control group.
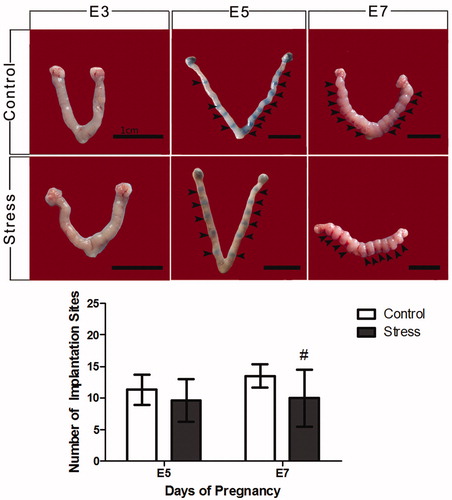
Figure 3. Photomicrographs show the effects of restraint stress on the distribution and density of uNK cells and mast cells in the uteri of pregnant mice on E3, E5, and E7. The morphology of uNK cells in the endometrium and mast cells in the myometrium was examined by staining with PAS and toluidine blue, respectively. Long arrows indicate positive-staining uNK cells in the endometrium, and short arrows indicate positive-staining mast cells in the myometrium. Scale bars = 50 μm. The density of uNK cells (a) in the endometrium and mast cells (b) in the myometrium are shown. Data (cells/mm2) were expressed as the mean ± SD. The meaning of the letters in the bar chart is the same as . #p < 0.01 were used to denote significance compared with the corresponding control groups. uNK cells, uterine natural killer cells; MCs, mast cells; End, endometrium; UL, uterine lumen; DB, decidua basalis; RUL, residual uterine lumen; LSM, outer longitudinal smooth muscle of uterine wall; CSM, inner circular smooth muscle of uterine wall; Ug, uterine gland; VLa, vascular layer.
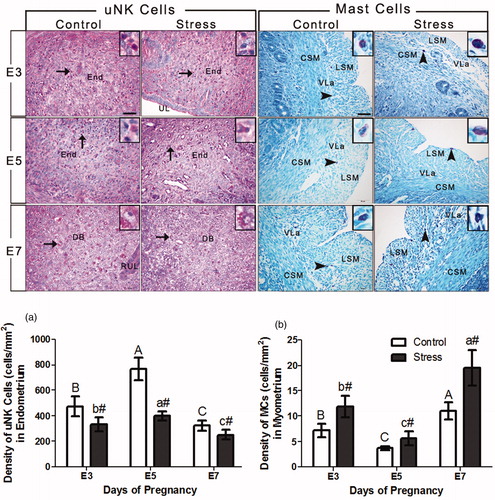
Figure 4. Effects of restraint stress on the T lymphocyte subsets in the uterus on E3, E5, and E7. The bar chart shows the CD3+CD4+ T/CD3+CD8+ T cell ratio between the stressed and control groups. Values were expressed as the mean ± SD. The meaning of the letters in the bar chart is the same as . *p < 0.05 and #p < 0.01 were used to denote the significance compared with the corresponding control groups.
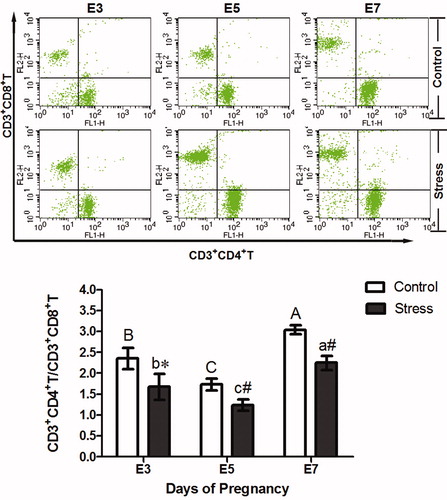
Figure 5. Effects of restraint stress on proliferation and cytokine secretion by uterine lymphocytes on E3, E5, and E7. The results show the proliferation ability of uterine lymphocytes induced by ConA (a) and LPS (b) in the control and the stressed group on E3, E5, and E7. A comparative statistical analysis shows the changes in IL-2 (c), IL-4 (d), and the IL-2/IL-4 ratio (e) in the uterus between the control and stressed groups on E3, E5, and E7. Values were expressed as the mean ± SD. The meaning of the letters in the bar chart is the same as . *p < 0.05 and #p < 0.01 were used to denote the significance compared with the corresponding control groups.
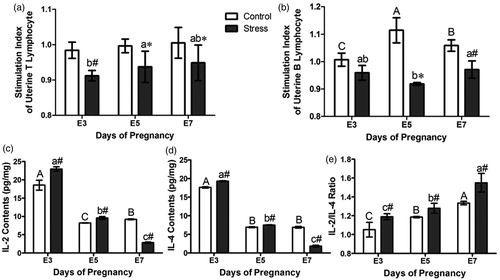
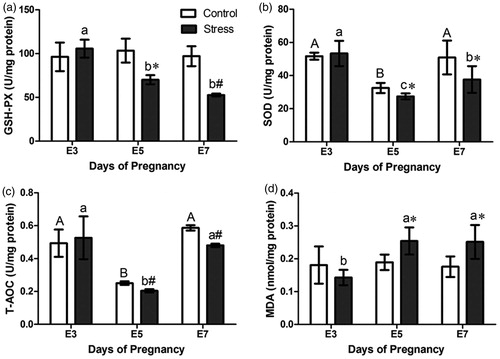
Figure 6. Effects of restraint stress on the oxidative stress states in the uterus on E3, E5, and E7. The bar chart shows the contents of GSH-PX (a), SOD (b), T-AOC (c), and MDA (d) in the uterus of the control and stressed groups on E3, E5, and E7. Values were expressed as the mean ± SD. The meaning of the letters in the bar chart is the same as . *p < 0.05 and #p < 0.01 were used to denote the significance compared with the corresponding control groups.