Figures & data
Figure 1. Respirometry setup employed to measure rate of oxygen consumption. : measurement of water vapor pressure, BP: barometric pressure,
: measurement of partial pressure of oxygen and
: measurement of partial pressure of carbon dioxide.
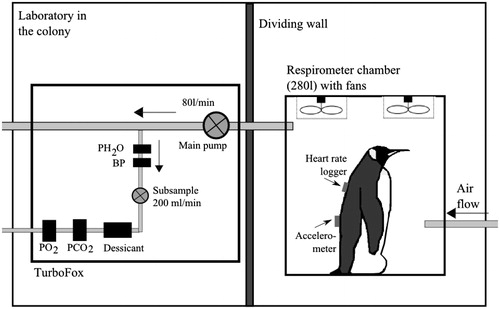
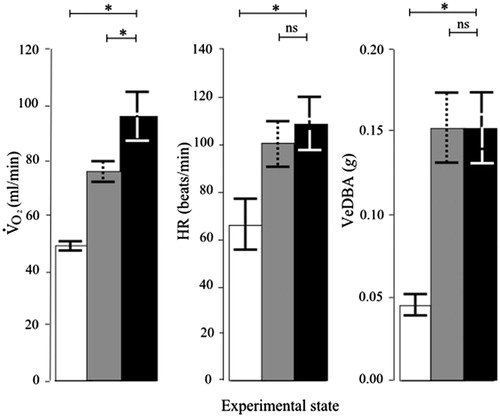
Figure 2. Cardio-respiratory stress responses of incubating king penguins. Values are means ± SEM. : rate of oxygen consumption; HR: heart rate; VeDBA: vectorial sum of dynamic body acceleration (indicating levels of body movement). Data are for the same penguins, each in the chamber throughout (repeated measures design; N = 6). Open bars: before stressor; gray bars: before stressor but with similar movement levels to stressed penguins; black bars: during stressor exposure. Asterisks indicate p < 0.05 and ns indicates p > 0.05, paired t-tests.