Figures & data
Figure 1. Experimental protocol and time line. (A) After splitting individuals in early and late emergers using an emergence test, baseline data were collected for both locomotion activity (behavioral recording in a twelve-well plate) and whole-body cortisol levels. Then, a netting stress paradigm was applied, and locomotion activity and cortisol levels over time were measured after the stress event. (B) Time line of the experiment with durations of the different procedures indicated.
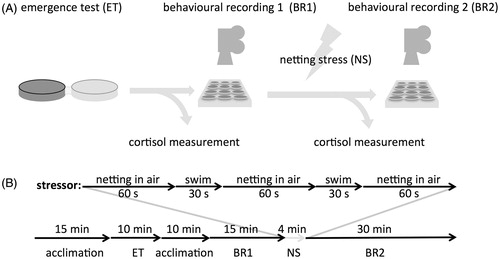
Figure 2. Time of emergence (tE) plotted against ranking in the emergence sequence (sE) of 14 larvae emerging within 10 min during an emergence test. Ten batches of 15 larvae were allowed to emerge without sampling, and their emergence times were recorded. Data shown are means ± SEM. The resulting curve was fitted using the function: tE = − 1.7282sE + 20.467 (r2 = 0.74). Empty and full circles correspond with early and late emergers, respectively, grey circles are intermediate emergers.
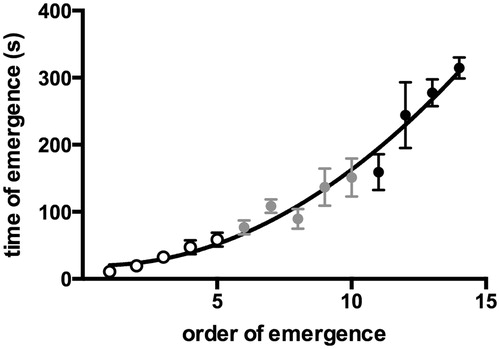
Figure 3. Kinematic parameters of locomotion behavior in early emerging (empty circles) and late emerging (full circles) larvae before and after netting stress. (A) Cumulative distance moved (Dcum) over 15 min, recorded before netting stress. (B) Swimming velocity (V) averaged over 15 min, recorded before netting stress. (C) Minimum turning radius (Rmin, mm) average over 15 min, recorded before netting stress. (D) Dcum over time after netting stress (1 min intervals). Tcrit indicates the earliest time point (893 s) at which there is a significant difference between LE and EE values of Dcum values. (E) V over time after netting stress (1 min averages). Lines indicate linear regression curves. (F) Rmin over time after netting stress (1 min averages). Lines indicate linear regression curves. All values are average ± SEM. *Indicates significant differences in values (A–C) or slopes (D–F) (p < 0.05).
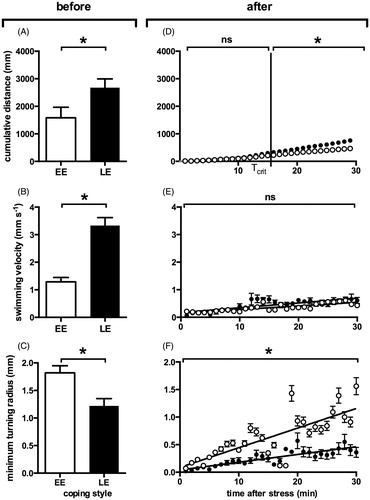
Figure 4. Recovery time to baseline levels as extrapolated from linear regression parameters in early emerging (EE) and late emerging (LE) larvae after netting stress. (A) Recovery time to baseline levels of V. (B) Recovery time to baseline levels of Rmin. All values are mean ± SEM. *Indicates significant differences (p < 0.05).
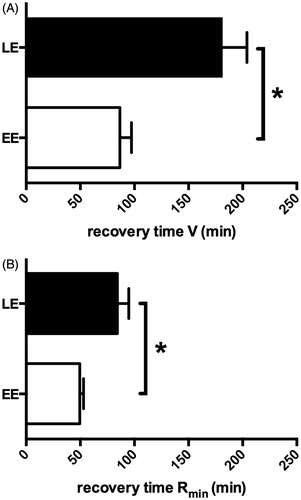
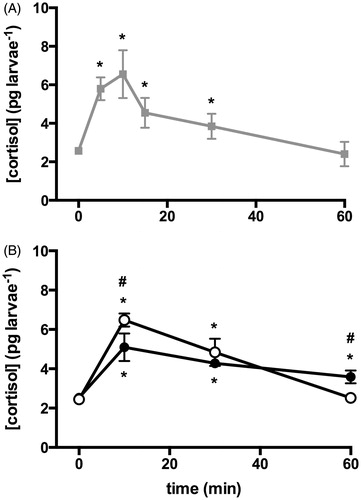
Figure 5. Whole-body cortisol concentration per larva (pg larva−1) after netting stress. (A) Cortisol concentrations at baseline (0) and 5, 10, 15, 30, 60 and 120 min after the start of the stressor. Larvae were of undetermined coping style. Cortisol levels peak at 10 min and are back to basal level at 60 min after the start of the stressor. *Indicates significant difference from baseline levels (p < 0.05, N = 10). (B) Cortisol concentrations at baseline (0) and 10, 30 and 60 min after the start of the stressor in different coping styles (EE empty, LE full circles). At the peak of the curve (10 min), the EE larvae show higher cortisol levels, and reach baseline levels faster than LE larvae. All values are mean ± SEM. *Indicates significant difference from baseline levels, and #indicates differences between coping styles (p < 0.05, N = 10).