Figures & data
Figure 1. CUS caused impairment of spatial learning and memory in the Morris water maze. (A) CUS exposure rats expend a longer time to escape onto hidden platform than control rats (*p < 0.01 compared to control). (B) CUS induced memory retrieval impairment as indicated by less time to search for in the target quadrant than control rats (Con, 37.99 ± 5.27%; CUS, 22.02 ± 2.9%. *p < 0.05, CUS versus Con). (C) There was no significant difference among the CUS groups and control group for the swim speed. (Con: n = 9, CUS: n = 9. p > 0.05).
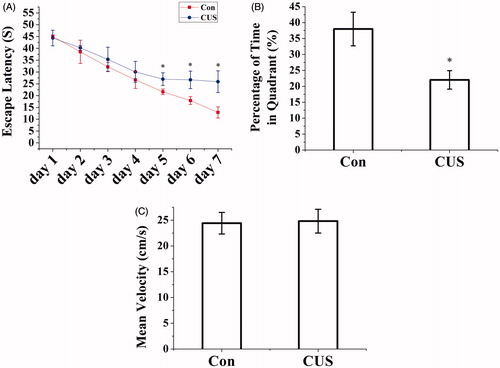
Figure 2. CUS caused impairment of hippocampal long-term potentiation. (A) LTP was induced in hippocampal pyramidal neurons in control rats (167.88 ± 2.34% of baseline, n = 6 slices/6 rats, t-test; p < 0.01 compared with baseline). (B) LTP was attenuated in hippocampal pyramidal neurons in CUS-treated rats (104.22 ± 3.38%, n = 6 slices/6 rats, t-test; p < 0.05 versus Con). Pairing training is indicated by an arrow. The dashed line indicates the mean basal synaptic responses.
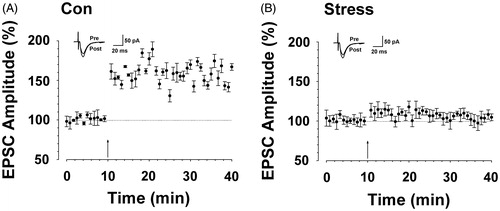
Figure 3. CUS induced activation of microglia and expression of TNF-α and IL-1β. Microglia activation was detected by immunocytochemistry (OX42) (hippocampal DG zone). (A–C) control group; (D–F) CUS group. (G) The results were quantified (Con: 3.5 ± 0.53%; CUS: 21.3 ± 1.3%, n = 20). Results (A–F) are expressed as the mean ± SD of relative increase of the activated microglia cells in random fields (n = 20). *p < 0.05 versus control groups. Scale bar indicates 50 μm. TNF-α (Con: 41.42 ± 7.35 pg/g; CUS: 88.40 ± 19.36 pg/g, n = 6) (H) and IL-1β (Con: 738.32 ± 77.38 pg/g; CUS: 1411.25 ± 145.30 pg/g, n = 6) (I) were determined by ELISA (n = 6). *p < 0.05 versus control groups.
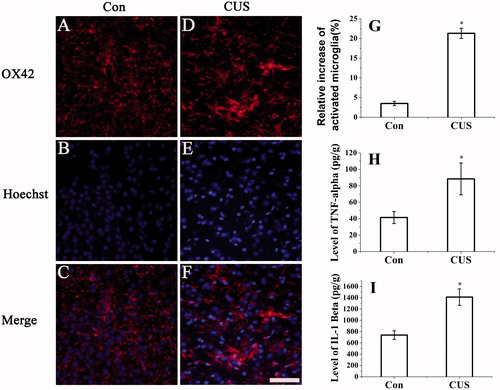
Figure 4. Minocycline treatment inhibited the activation of microglia and CUS-induced secretion of TNF-α and IL-1β. Microglia activation was detected by OX42 antibody (hippocampal DG zone). (M) The results were quantified (Con: 2.63 ± 1.15%; Con + Minocycline: 2.74 ± 1.25%; CUS: 22.27 ± 3.68%; CUS + Minocycline: 11.02 ± 2.28%, n = 20). Results (A–L) are expressed as the mean ± SD of relative increase of the activated microglia cells in random fields (n = 20). *p < 0.05 versus control groups. #p < 0.05 versus CUS groups. TNF-α (Con: 33.96 ± 4.63 pg/g; Con + Minocycline: 37.85 ± 7.49 pg/g; CUS: 92.62 ± 10.42 pg/g; CUS + Minocycline: 54.61 ± 9.38 pg/g, n = 6) (N) and IL-1β (Con: 717.05 ± 70.35 pg/g; Con + Minocycline: 793.63 ± 68.36 pg/g; CUS: 1308.74 ± 115.32 pg/g; CUS + Minocycline: 970.76 ± 150.25 pg/g, n = 6) (O) were determined by ELISA (n = 6). *p < 0.05 versus control groups. #p < 0.05 versus CUS groups.
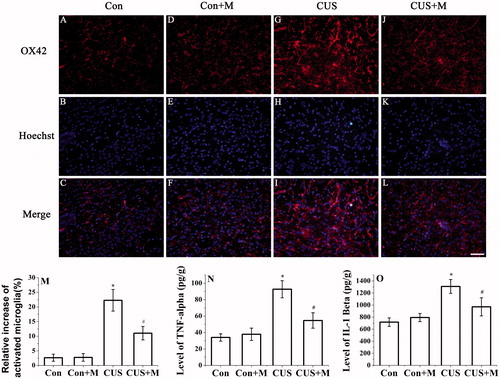
Figure 5. Minocycline treatment restored hipopocampal GluR1 phosphorylation in CUS-exposed rats. Stress significantly inhibit GluR1 phosphorylation compared to controls (Ser845: Con, 100.00 ± 8.04% of total GluR1; CUS, 46.00 ± 6.36% of total GluR1, n = 6. Ser831: Con, 100.00 ± 7.61% of total GluR1; CUS, 65.96 ± 3.25% of total GluR1, n = 6) (*p < 0.05). Minocycline treatment reverses the inhibition of CUS on hipopocampal GluR1 phosphorylation (Ser845: CUS + Minocycline, 66.40 ± 9.70% of total GluR1, n = 6. Ser831: CUS+Minocycline, 98.78 ± 10.35% of total GluR1, n = 6) (#p < 0.05). There is no significant difference between the control and control plus minocycline groups (Ser845: Con+Minocycline, 90.81 ± 10.78% of total GluR1, n = 6. Ser831: Con+Minocycline, 85.78 ± 13.37% of total GluR1, n = 6). *p < 0.05 versus control. #p < 0.05 versus CUS. Data are presented as mean ± SD.
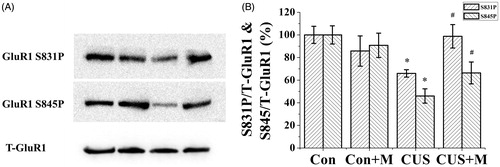
Figure 6. Minocycline treatment alleviated spatial memory impairment induced by CUS. (A) CUS exposure rats require a longer time to escape onto hidden platform than control rats (*p < 0.05). Minocycline treatment (CUS + Minocycline) reduces the escape latency time than CUS group (#p < 0.05). (B) CUS induced memory retrieval impairment as indicated by less time to search for in the target quadrant (*p < 0.05 versus control groups). Minocycline treatment enhanced the search time in target quadrant than CUS group (*p < 0.05) (Con: 40.76 ± 11.05%; Con + Minocycline: 40.26 ± 7.83%; CUS: 21.58 ± 5.76%; CUS + Minocycline: 32.24 ± 8.37%). (C) There was no significant difference among each group for the swim speed (Con: n = 8, Con + Minocycline: n = 9, CUS: n = 9, CUS + Minocycline: n = 9. p > 0.05).
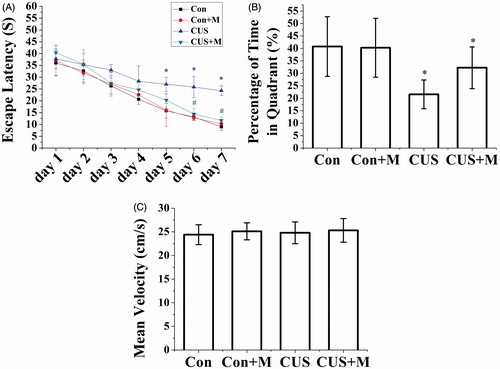
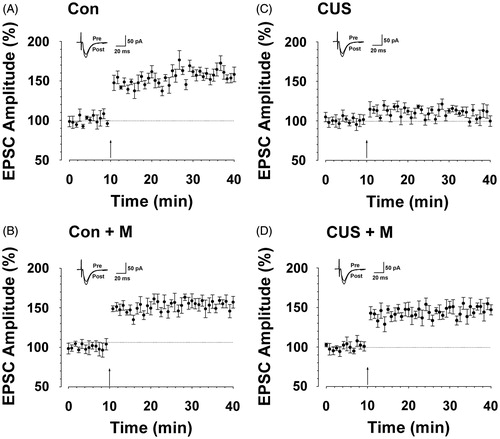
Figure 7. Minocycline treatment alleviated hipopocampal long-term potentiation impairment induced by CUS. (A) LTP was induced in hippocampal pyramidal neurons in control rats (164.14 ± 17.01%, n = 7 slices/7 rats, t-test; p < 0.05 compared with baseline). (B) LTP was induced in hippocampal pyramidal neurons in minocycline-treated rats (154.10 ± 13.08%, n = 8 slices/7 rats, t-test; p < 0.05 compared with baseline). (C) LTP was lost in hippocampal pyramidal neurons in CUS-treated rats (104.88 ± 8.99%, n = 9 slices/7 rats, t-test; p > 0.05 compared with baseline). (D) LTP was partly reversed in hippocampal pyramidal neurons in minocycline-treated rats during CUS exposure (149.84 ± 19.45%, n = 8 slices/seven rats, t-test; p < 0.05 compared with baseline). Pairing training is indicated by an arrow. The dashed line indicates the mean basal synaptic responses.