Figures & data
Table 1. The demographic variables, PMS scores and sex hormones levels of PMS and control women tested in the follicular phase and the late luteal phase (mean ± standard deviation).
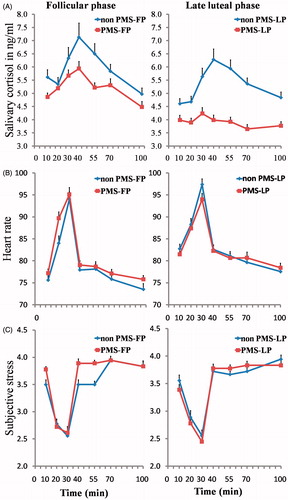
Figure 1. Changes in salivary cortisol (A), heart rate (B) and subjective stress (C) after the TSST for PMS and control women in the follicular phase and the late luteal phase. Data represent mean ± SEM (baseline from 0 to 10 min, preparation from 10 to 20 min, TSST from 20 to 30 min, first recovery from 30 to 40 min, second recovery from 40 to 55 min, third recovery from 55 to 70 min and fourth recovery from 70 to 100 min).