Figures & data
Figure 1. Effects of restraint stress on exploration of the elevated plus-maze (EPM), plasma corticosterone concentrations and systolic blood pressure. (A) The rats were tested in the EPM and results represent the percent of open arm exploration [% entries (open bars) and time spent (hatched bars) in open arms]. Values are mean ± SEM of n = 9 for each group. (B) Plasma corticosterone was evaluated by radioimmunoassay in control (n = 7) and stressed rats (n = 8). (C) Systolic arterial pressure was evaluated by plethysmography before or 2 and 24 h after restraint (n = 8 for each group). *Compared to control group (p < 0.05, Student’s t-test).
![Figure 1. Effects of restraint stress on exploration of the elevated plus-maze (EPM), plasma corticosterone concentrations and systolic blood pressure. (A) The rats were tested in the EPM and results represent the percent of open arm exploration [% entries (open bars) and time spent (hatched bars) in open arms]. Values are mean ± SEM of n = 9 for each group. (B) Plasma corticosterone was evaluated by radioimmunoassay in control (n = 7) and stressed rats (n = 8). (C) Systolic arterial pressure was evaluated by plethysmography before or 2 and 24 h after restraint (n = 8 for each group). *Compared to control group (p < 0.05, Student’s t-test).](/cms/asset/cb8e3535-c2c1-4c19-a707-058d367b939a/ists_a_1014790_f0001_b.jpg)
Figure 2. Effects of restraint stress on the vascular reactivity of isolated aortas to phenylephrine, serotonin (5-HT), acetylcholine and sodium nitroprusside (SNP). The contraction induced by phenylephrine and 5-HT were determined in endothelium-intact (Endo+) and endothelium-denuded (Endo−) rat aortic rings. Relaxation to acetylcholine and SNP were obtained in Endo+ and Endo− aortic rings, respectively. Values are mean ± SEM of n = 6 for control and n = 9 for stressed rats. *Maximum effect elicited by the agonist (Emax) compared to control group Endo+ (p < 0.05, ANOVA followed by Bonferroni’s multiple comparison test).
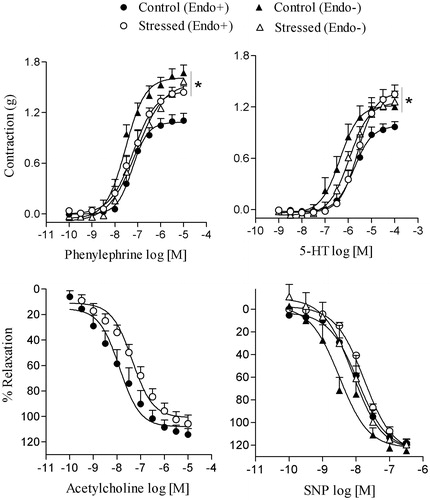
Table 1. Effect of several inhibitors on the Emax (grams) and pD2 (−log EC50) values for contractile actions of phenylephrine on endothelium-intact rat aortic rings.
Figure 3. Effects of restraint stress on prostaglandin (PG)F2α and thromboxane (TX)B2 concentrations in the rat aorta. Basal concentration of PGF2α (A) and TXB2 (B), a stable metabolite of TXA2, were measured in the rat aorta by enzyme immunoassay. Results are mean ± SEM of n = 6 for control and n = 7 for stressed rats. *Compared to control group (p < 0.05, Student’s t test).
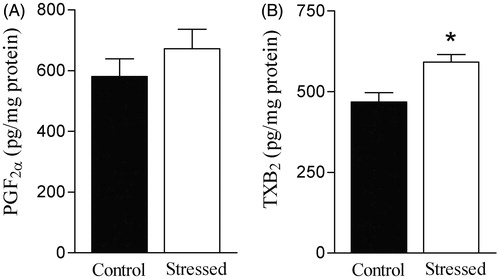
Figure 4. Effects of restraint stress on systemic and vascular oxidative stress and basal nitrate/nitrite (NOx) levels. (A) Visualization of reactive oxygen species (ROS) generation in aorta slices detected with fluorescent dye dihydroethidium (DHE); note stronger signal after stress. (B) Bar graphs represent lucigenin-chemiluminescence in aortic tissue, (C) plasma concentrations of thiobarbituric acid reactive substances (TBARS). (D) Basal plasma, and (E) aortic nitrate/nitrite (NOx). Results are mean ± SEM of n = 7 for control and n = 11 for stressed rats. *Compared to control group (p < 0.05, Student’s t test).
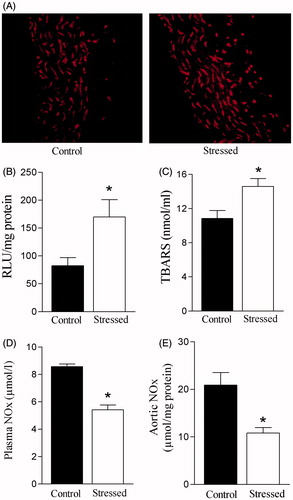
Figure 5. Effects of restraint stress on endothelial NOS (eNOS), inducible NOS (iNOS), cyclooxygenase (COX)-1 and COX-2 expression in the rat aorta. Upper panels, representative immunoblots for eNOS, iNOS, COX-1 and COX-2 protein expression. Lower panels, corresponding bar graphs show densitometric data for expression of (A) eNOS, (B) iNOS, (C) COX-1 and (D) COX-2. Results are mean ± SEM of n = 4 for control and n = 6 for stressed rats. *Compared to control group (p < 0.05, Student’s t-test).
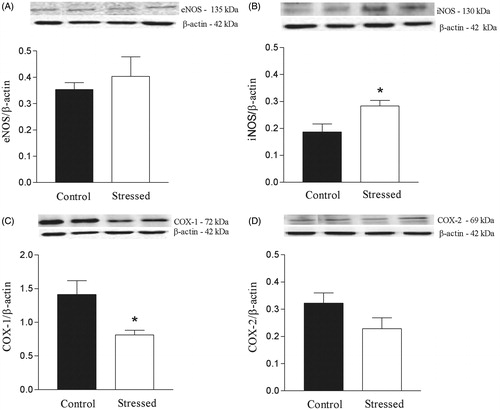
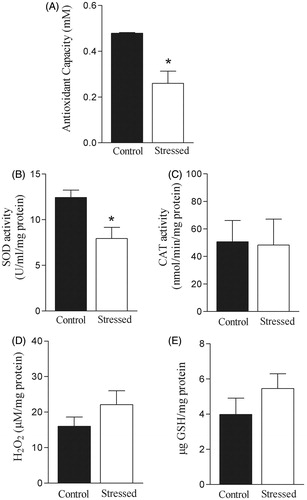
Figure 6. Effects of restraint stress on antioxidant system and hydrogen peroxide (H2O2) concentration. Total antioxidant capacity was evaluated in the plasma (A). Superoxide dismutase (SOD, B) and catalase (CAT) activities (C) as well as H2O2 (D) and reduced glutathione (GSH) concentration (E) were determined in the aorta. Results are presented as mean ± SEM of n = 6 for control and n = 8 for stressed rats. *Compared to control group (p < 0.05, Student’s t test).