Figures & data
Figure 1. Immature and mature female and male Drosophila display distinct motor patterns. Data were collected from min 15–20 in an open-field arena, during which time the animals had habituated to the novel environment. (A–C) Motor pattern. (A) Mean distance moved; (B) mean velocity; (C) mean turn angle. (D–E) Freezing behavior. (D) Duration not moving; (E) frequency not moving. (F–G) Escape behavior. These included hops of velocity greater than 50 mm/s, as well as short bursts of flight. (F) Duration highly mobile; (G) frequency of high mobility. Two-way ANOVA followed by Bonferroni post tests. Statistical analyses are discussed in the text. n = 40 for each population.
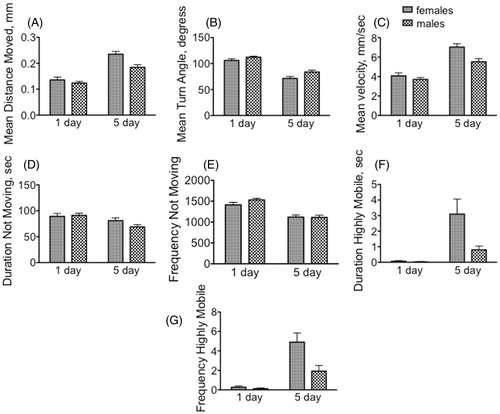
Table 1. Sexual maturity has a striking influence on behavioral outcomes in each paradigm.
Table 2. Sexually mature males and females display a strongly dimorphic response in several behavioral paradigms.
Figure 2. Sexually mature males and females display dimorphic and distinct responses in three different paradigms relative to immature flies. (A–B) light–dark box. (A) Amount of time spent in light (min 10–15 of the 15 min observation period). (B) Number of transitions between the light and dark sides of the arena during min 10–15 of the 15 min observation period. (C–E) Forced Swim Test. (C) latency to first bout of immobility; (D) number of bouts; (E) average bout duration. (F–G) Response to the sedative effects of ethanol. (F) seconds until sedation; (G) seconds until recovery from sedation. Two-way ANOVA followed by Bonferroni post tests. Statistical analyses are discussed in the text. n = 30 for each population.
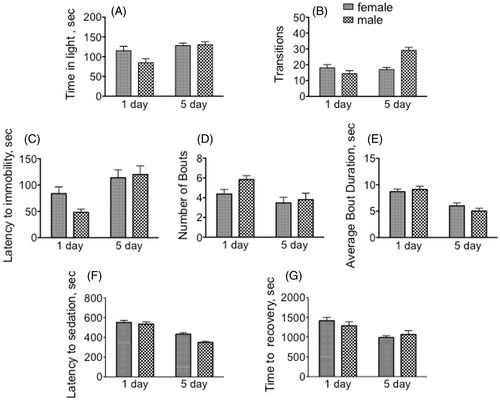
Table 3. Effects of diverse stressors on different locomotor parameters in immature and mature male and female Drosophila.
Figure 3. The effect of stressors on time spent in the lit arena in the light–dark box. (A) Sexually immature females; (B) sexually immature males; (C) sexually mature females; (D) sexually mature males. Statistical comparisons between control and stress conditions within a population, **p < 0.01, one-way ANOVA followed by Dunnett's post test.
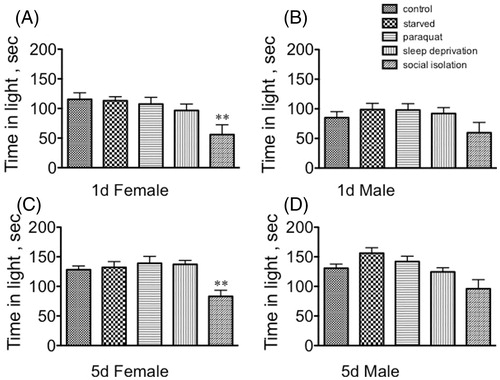
Figure 4. The effect of stressors on number of transitions in the light–dark box. (A) Sexually immature females; (B) sexually immature males; (C) sexually mature females; (D) sexually mature males. Statistical comparisons between control and stress conditions within a population, *p < 0.05, ***p < 0.001, one-way ANOVA followed by Dunnett's post test.
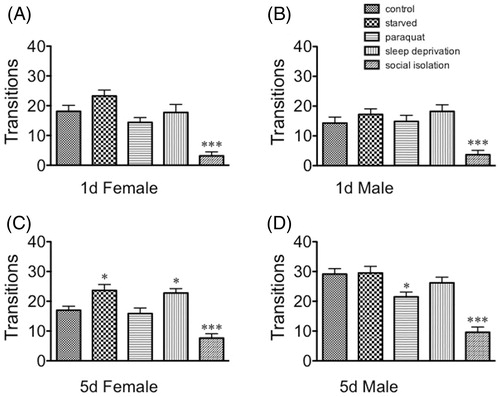
Figure 5. The effect of stressors on behavioral parameters of the forced swim test. (A–D) Latency to first bout of immobility; (E–H) number of bouts; (I–L) bout duration. (A, E, I) Sexually immature females; (B, F, J) sexually immature males; (C, G, K) sexually mature females; (D, H, L) sexually mature males. Statistical comparisons between control and stress conditions within a population, *p < 0.05, **p < 0.01, ***p < 0.001, one-way ANOVA followed by Dunnett's post test. n = 30 for each population.
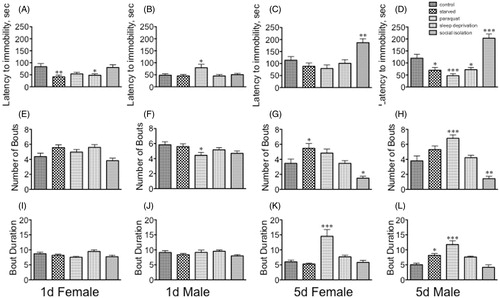
Figure 6. The effect of stressors on immobility with increasing time during the forced swim test. (A) Sexually immature females; (B) sexually immature males; (C) sexually mature females; (D) sexually mature males. Statistical comparisons between control and stress conditions for each time point within a population, *p < 0.05, **p < 0.01, ***p < 0.001, one-way ANOVA followed by Dunnett's post test. n = 30 for each population.

Figure 7. The effect of stressors on the sensitivity to the sedative effects of ethanol. (A) Sexually immature females; (B) sexually immature males; (C) sexually mature females; (D) sexually mature males. Statistical comparisons between control and stress conditions within a population, **p < 0.01, one-way ANOVA followed by Dunnett's post test. n = 30 for each population.
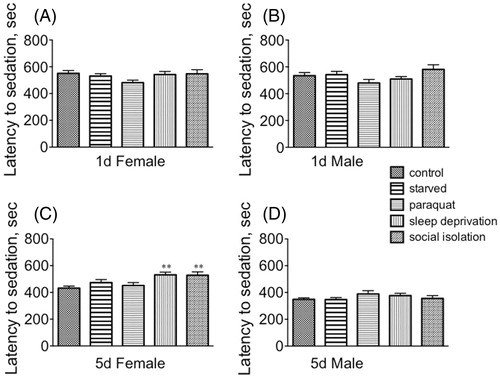
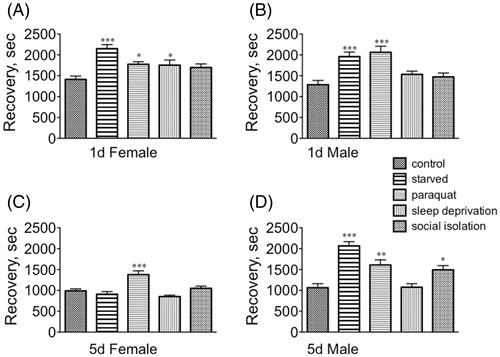
Figure 8. The effect of stressors on the rate of recovery from ethanol sedation. (A) Sexually immature females; (B) sexually immature males; (C) sexually mature females; (D) sexually mature males. *p < 0.05, **p < 0.01, ***p < 0.001, one-way ANOVA followed by Dunnett's post test. n = 30 for each population.