Figures & data
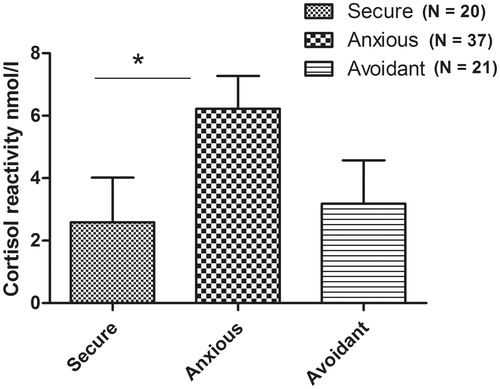
Figure 1. Mean (±SEM) salivary free cortisol concentrations (nanomoles per litre) for all participants (n = 78). (A) Immediately before onset of the TSST-G; (B) mid-way through the TSST-G and (C) immediately after the end of the TSST-G.
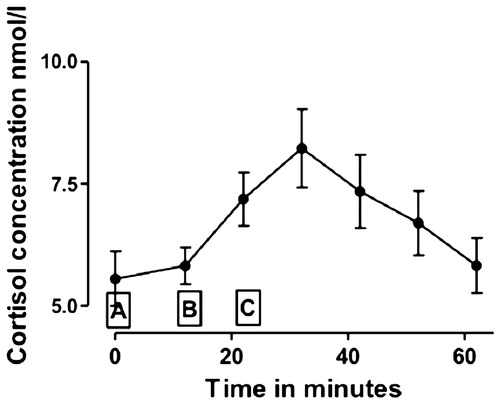
Table 1. Descriptive statistics and intercorrelations between cortisol, VASQ attachment measures and demographic data (n = 78).
Table 2. Prediction of cortisol reactivity.
Figure 2. Attachment style differences in cortisol reactivity. Reactivity is significantly greater for the insecure anxious attachment style group in comparison to the securely attached group (p = 0.011).