Figures & data
Figure 1. The effects of CORT administration on LTP induced by TBS. (A) Representative waveforms of CA1 and DG responses to VHC and PP stimulation, respectively, before and after TBS. (B) Baseline PS responses recorded from the DG and CA1 in response to test stimuli delivered to the PP or VHC. (C) Mean percentage (±SEM) of baseline responses in the DG before and after TBS. CORT10 administration 1 h before TBS increased LTP of the PS in the DG in comparison to control and CORT20 group. (D) Mean percentage (±SEM) of baseline responses in the CA1 before and after TBS. CORT20 administration 1 h before TBS impaired LTP of the CA1 PS in comparison to control group, but not CORT10 group. Asterisks (*) indicate significant differences (p < 0.05) between groups using post hoc Benferroni tests.
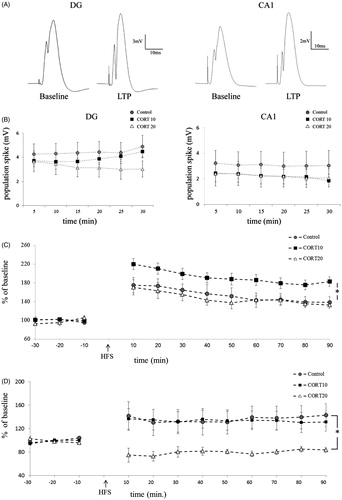
Figure 2. The effects of CORT administration on PPS response at ISI of 15 ms in the CA1 and the DG. (A) Representative analog traces recorded from the CA1 and DG during PPS protocol (ISI = 15 m). (B) The PPS response was calculated by dividing the EPSP slope or PS size of the second response by that of the first (the baseline response). CORT administration did not affect PPS response in the CA1. In the DG, CORT20 affected inhibition of the EPSP slope of EPSP (*p < 0.05) and demonstrated a similar tendency also with regards to the PS, although this effect was not statistically significant.
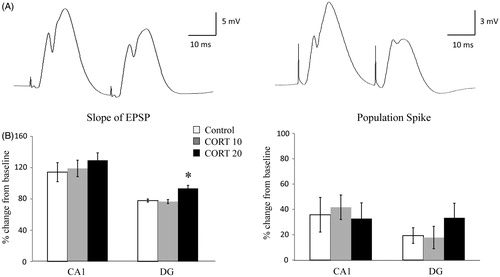
Figure 3. The effects of CORT administration on PPS response at ISI of 80 ms in the CA1 and in the DG. (A) Representative analog traces recorded from the CA1 and DG during PPS protocol (ISI = 80 ms). (B) The PPS response was calculated by dividing the EPSP slope or PS size of the second response by that of the first (the baseline response). CORT20 increased PPS excitation in the DG, of both slope of EPSP (*p < 0.05) and PS size (*p < 0.05). CORT did not affect PPS response in the CA1 area.
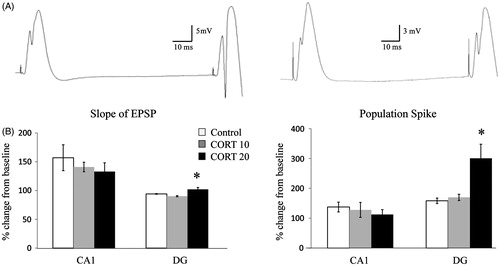
Figure 4. The effects of CORT administration and TBS on local circuit plasticity in the CA1. (A) No alterations were found in the CA1 for the effects of PPS with an ISI of 15 ms on EPSP slope or PS size following TBS. (B) No alterations were found in the CA1 for the effects of PPS with an ISI of 80 m on either EPSP slope or PS size following TBS.
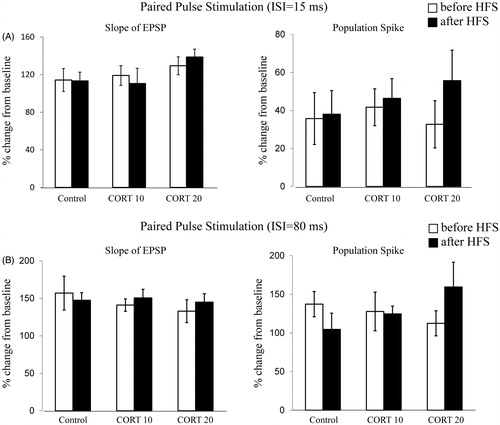
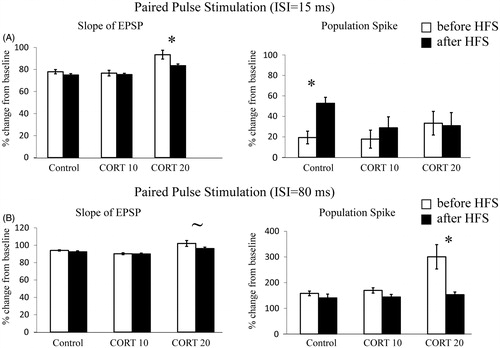
Figure 5. The effects of CORT administration and TBS on local circuit plasticity in the DG. (A) The effects of CORT administration and HFS on PPS response, ISI = 15 ms. TBS abolished CORT20 effects on PPS-induced inhibition of EPSP slope, and inhibition returned to a level similar to CORT10 and to control groups (*p = 0.05). In addition, TBS reduced PPS-induced PS size inhibition to only 50% in the control group (*p < 0.005). This effect was abolished in both CORT10 and CORT20 groups. (B) The effects of CORT administration and TBS on PPS response, ISI = 80 ms. In the CORT20 group, TBS abolished PPS-induced reduced inhibition of both the EPSP slope and the PS size, which brought them to a facilitation level that was similar to CORT10 and to vehicle groups (*p < 0.05). Asterisks (*) indicate significant differences (p < 0.05) between groups using paired t-test. (∼) Indicates marginal significance (p = 0.053).