Figures & data
Figure 1. Experimental design. Postnatal stress or no disturbance (Control) from postnatal days (PD) 7–27. From PD 27–34 given to drink either: water, and dextrose: 1% solution (g/100 ml); or water, and ethanol: 6% solution (g/100 ml).
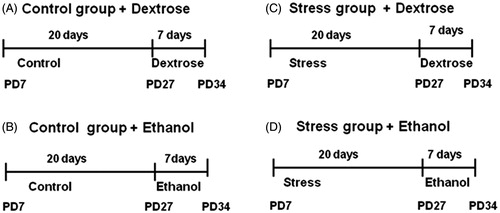
Figure 2. Ethanol intake. (A) Voluntary ethanol expressed in grams of ethanol (EtOH) consumed/kg body weight/day. (B) Indicates volume of 6% ethanol intake per cage (of three rats) per day. Values are the mean ± SEM for seven cages. t-test, ****p < 0.0001, ***p < 0.01.
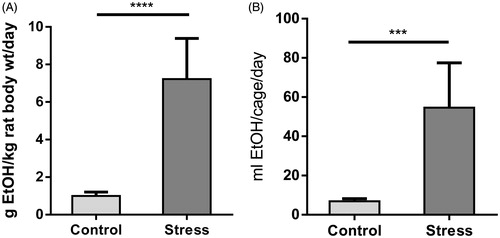
Figure 3. Time course of [3H]-l-glutamate uptake in fresh synaptosome-enriched fractions of frontal cortex (FC) and hippocampus (Hic). Samples were incubated with [3H]-l-glutamate at 10 nmol/l substrate concentrations, for 1–30 min. Values are the mean ± SEM (n = 5–6 rats per group), all the experiments were done in triplicate. Control, no postnatal stress; stress, chronic postnatal stress; dex, water and 1% dextrose to drink; EtOH, water and 6% ethanol to drink. Two-way ANOVA with repeated measures, *p < 0.05, **p < 0.01, ***p < 0.001.
![Figure 3. Time course of [3H]-l-glutamate uptake in fresh synaptosome-enriched fractions of frontal cortex (FC) and hippocampus (Hic). Samples were incubated with [3H]-l-glutamate at 10 nmol/l substrate concentrations, for 1–30 min. Values are the mean ± SEM (n = 5–6 rats per group), all the experiments were done in triplicate. Control, no postnatal stress; stress, chronic postnatal stress; dex, water and 1% dextrose to drink; EtOH, water and 6% ethanol to drink. Two-way ANOVA with repeated measures, *p < 0.05, **p < 0.01, ***p < 0.001.](/cms/asset/d97dc7f0-ed26-4f81-9cec-eadb039dd15b/ists_a_1041909_f0003_b.jpg)
Figure 4. Effect of glial glutamate transporter-1 (GLT-1) inhibitor dihydrokainate (DHK, 500 mM) on 5 min [3H]-l-glutamate uptake. Fresh synaptosome-enriched fractions from frontal cortex (FC) and hippocampus (Hic). Values are the percentage of inhibition, calculated as the difference in uptake with and without inhibitor (n = 5–6 rats per group) all the experiments were done in triplicate. Values are mean + SEM. Two-way ANOVA and main effects, *p < 0.05.
![Figure 4. Effect of glial glutamate transporter-1 (GLT-1) inhibitor dihydrokainate (DHK, 500 mM) on 5 min [3H]-l-glutamate uptake. Fresh synaptosome-enriched fractions from frontal cortex (FC) and hippocampus (Hic). Values are the percentage of inhibition, calculated as the difference in uptake with and without inhibitor (n = 5–6 rats per group) all the experiments were done in triplicate. Values are mean + SEM. Two-way ANOVA and main effects, *p < 0.05.](/cms/asset/5b71465d-7b62-4965-8d20-59491617680d/ists_a_1041909_f0004_b.jpg)
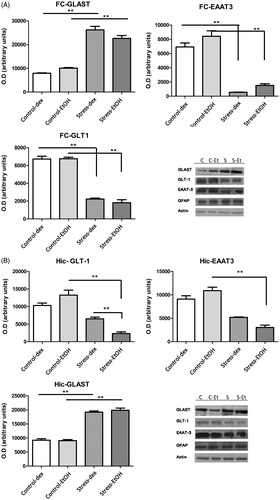
Figure 5. Western-blot analysis for glutamate transporter proteins. Measurements were made on glutamate aspartate transporter (GLAST; MW ∼66 kDa), glial glutamate transporter-1 (GLT1; MW ∼52 kDa) and excitatory amino-acid transporter-3 (EAAT3; MW ∼57 kDa) in homogenates of frontal cortex, FC (A) and hippocampus, Hic (B). Band densities were quantified and are shown as a bar chart (OD: optical density). The expression level corresponds to the number of black pixels of each band counted using Image J. Actin (MW ∼42 kDa) served as a loading control. Glial fibrillary acidic protein (GFAP; MW ∼49 kDa) served as a glial marker. Blots are representative of three experimental groups for each blot. Control (C), no postnatal stress; stress (S), chronic postnatal stress; dex, water and 1% dextrose to drink; EtOH, water and 6% ethanol to drink. The FC and hippocampus from each rat was run separately. Data are mean ± SEM (n = 5 rats per group). Two-way ANOVA and main effects, *p < 0.05, **p < 0.01.