Figures & data
Table 1. Primary antibody concentrations for Western Blot analysis of phosphorylated glucocorticoid receptor (pGR), total glucocorticoid receptor (GR), FKBP51, steroid receptor co-activator (SRC)-1 and β-tubulin in the paraventricular nucleus (PVN), central amygdala (CeA) and ventral hippocampus (VH).
Figure 1. Schematic representation of experimental design. Rats underwent the conditioned place aversion (CPA) paradigm to index for the avoidance of predator-odor paired chamber. In Experiment 1, all rats received a subcutaneous vehicle (0.9% saline) injection prior to neutral conditioning (Day 1). The same rats were randomized to receive either vehicle or corticosterone (CORT) pretreatment prior to odor exposure (Day 2). In Experiment 2, the rats did not receive injections prior to conditioning and were euthanized at 48 h post-stress for biochemical analysis.
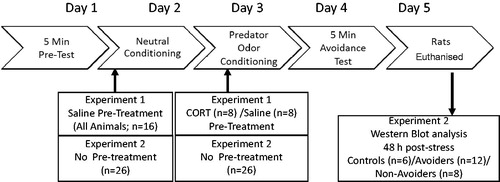
Figure 2. (A) Avoidance distribution in saline-treated rats. Non-Avoiders represented in gray and Avoiders represented in black. (B) Avoidance distribution in corticosterone (CORT)-treated rats. Non-Avoiders represented in gray and Avoiders represented in black. (C) Avoidance (Δ time pre-conditioning test to post-conditioning test time spent in predator-odor paired chamber) following pretreatment with either saline (white bar; n = 8) or corticosterone (black bar; n = 8). Data are presented as mean ± SEM and were analyzed using a t-test. *indicates p < 0.05 versus saline-treated rats.
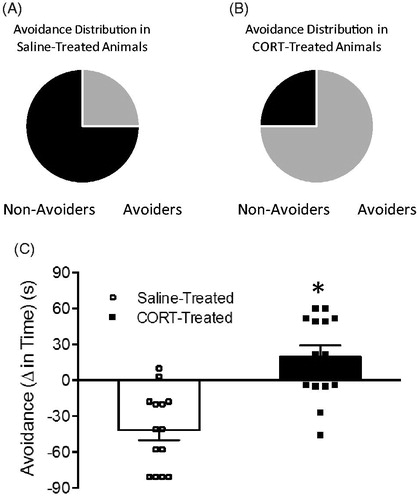
Figure 3. Changes in glucocorticoid receptor (GR) machinery in the paraventricular nucleus (PVN; anterior/posterior (AP): −1.72 mm, medial/lateral (ML): 0.0 mm, dorsal/ventral (DV): 8.5 mm). (A) Total GR protein content (% of controls). (B) Phosphorylated GR (pGR) protein content (expressed as a ratio of pGR/GR). (C) FK506 binding protein 51 (FKBP51) protein content (% of controls). (D) Steroid receptor co-activator (SRC)-1 protein content (% of controls) measured 48 h post-odor exposure in the PVN of controls (white bars; n = 6), Non-Avoiders (gray bars; n = 8) and Avoiders (black bars; n = 7). (E) Scatter plot for individual rats (Avoider, black dots and Non-Avoider, gray-filled circles; Experiment 2) shows avoidance of predator-paired context versus PVN SRC-1 protein expression 48 h post-stress. Rats that exhibited high avoidance of the predator-paired context 24 h post-odor exposure had lower PVN SRC-1 expression 48 h post-stress (p = 0.006). (F) Schematic representation of PVN punch dissection (Paxinos & Watson, Citation1997). Data are presented as mean ± SEM and were analyzed using a one-way ANOVA. #indicates treatment effect (p < 0.05). A post hoc analysis performed by Student Newman–Keuls.
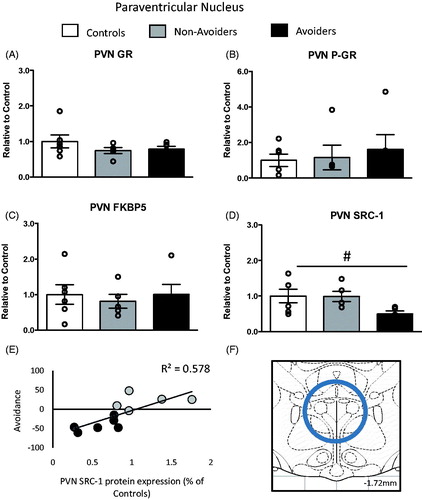
Figure 4. Changes in glucocorticoid receptor (GR) machinery protein content in the central amygdala (CeA; anterior/posterior (AP): −1.92 mm, medial/lateral (ML): 4.4 mm, dorsal/ventral (DV): 8.2 mm). (A) Total GR protein content (% of controls). (B) pGR protein content (expressed as a ratio of pGR/GR). (C) FK506 binding protein 51 (FKBP51) protein content (% of controls). (D) Steroid receptor co-activator (SRC)-1 protein content (% of controls) measured 48 h post-odor exposure in the CeA of controls (white bars; n = 6), Non-Avoiders (gray bars; n = 8) and Avoiders (black bars; n = 7). (E) Scatter plot for individual rats (Avoider, black dots and Non-Avoider, gray-filled circles; Experiment 2) shows a change in preference for predator-paired context versus CeA SRC-1 protein expression 48 h post-stress. Rats that exhibited high avoidance of the predator-paired context 24 h post-odor exposure tend to have lower CeA SRC-1 expression 48 h post-stress (p = 0.06). (F) Schematic representation of CeA punch dissection (Paxinos & Watson, Citation1997). Data are presented as mean ± SEM and analyzed using a one-way ANOVA. $indicates p < 0.05 versus control rats. *indicates p < 0.05 versus Non-Avoiders. A post hoc analysis performed by Student Newman–Keuls.
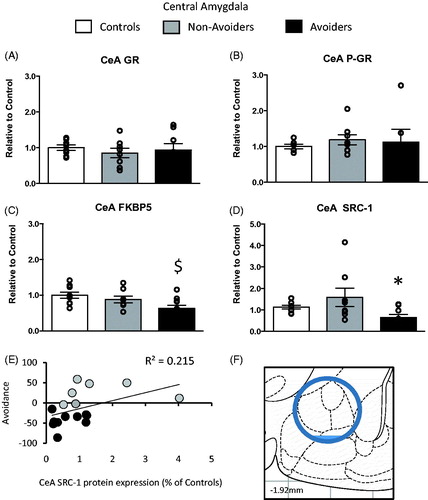
Figure 5. Changes in glucocorticoid receptor (GR) machinery protein content in the ventral hippocampus (VH anterior/posterior (AP): −5.04 mm, medial/lateral (ML): −5.2 mm, dorsal/ventral (DV): 7.2 mm). (A) Total GR protein content (% of controls). (B) pGR protein content (expressed as a ratio of pGR/GR). (C) FK506 binding protein 51 (FKBP51) protein content (% of controls). (D) Steroid receptor co-activator (SRC)-1 protein content (% of controls) measured 48 h post-odor exposure in the VH of controls (white bars; n = 6), Non-Avoiders (gray bars; n = 8) and Avoiders (black bars; n = 7). (E) Scatter plot for individual rats (Avoider, black dots and Non-Avoider, gray circles; Experiment 2) shows a change in preference for predator-paired context versus VH SRC-1 protein expression 48 h post-stress (p = 0.002). Rats that exhibited high avoidance of the predator-paired context 24 h post-odor exposure had higher VH SRC-1 expression 48 h post-stress. (F) Schematic representation of VH punch dissection (Paxinos & Watson, Citation1997). Data are presented as mean ± SEM and analyzed using a one-way ANOVA. $indicates p < 0.05 versus control rats. A post hoc analysis performed by Student Newman–Keuls.
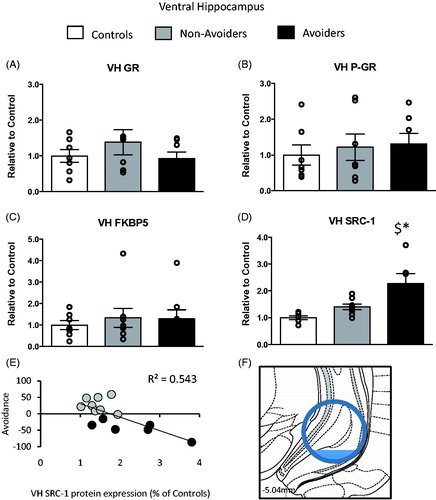
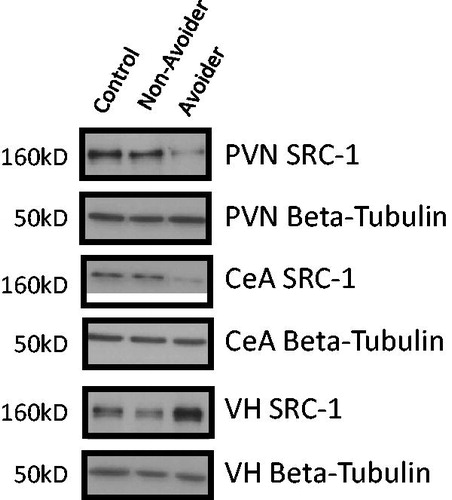
Figure 6. Representative western blot images for steroid receptor co-activator (SRC)-1 protein (molecular weight 160 kDa) and β-tubulin in paraventricular nucleus (PVN), central amygdala (CeA) and ventral hippocampus (VH) in Control (C; n = 6), Avoider (A; n = 7) and Non-Avoider (NA; n = 8) groups.