Figures & data
Figure 1. Plasma concentrations of hypothalamic (a, b) gonadotropin-releasing hormone (GnRH) (pg/ml) and (c, d) luteinising hormone (LH) (mlU/ml) in male (a, c) and female (b, d) rat offspring at E22 and P5, 14, 30, 60 after saline (control) or lipopolysaccharide (LPS; 18 μg/kg, i.p. on E12) administration to the mother on day 12 of pregnancy; data are M ± SD. Statistical analysis: two-way analysis of variance (details in Results text), followed analysis of differences at each time point of development by Tukey’s post hoc test; *p < 0.05 between groups at same age (n = 10 per group).
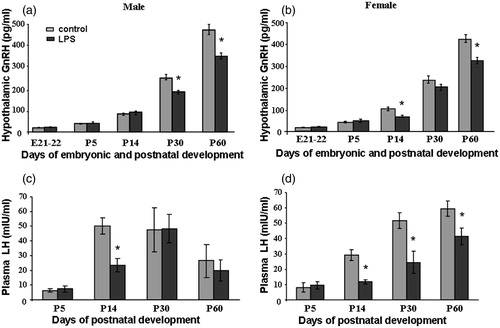
Figure 2. Effect of prenatal exposure to lipopolysaccharide (LPS; 18 μg/kg, i.p. on E12) on body weight in male (a) and female (B) offspring at P5 (n = 30 per group), P14 (n = 20 per group), and P30 (n = 10 per group). Data are M ± SEM. Statistical analysis: one-way analysis of variance: *р < 0.01 between groups at same age.
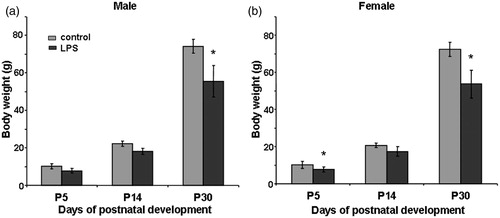
Figure 3. Effect of prenatal lipopolysaccharide (LPS) exposure on postnatal day of VO in female offspring, Kaplan–Meier plot for VO in control (n = 20, solid line) and LPS-treated (n = 21, dotted line) rats. Log-rank test between groups: p = 0.004.
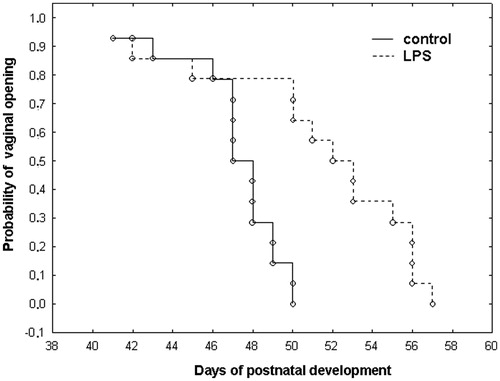
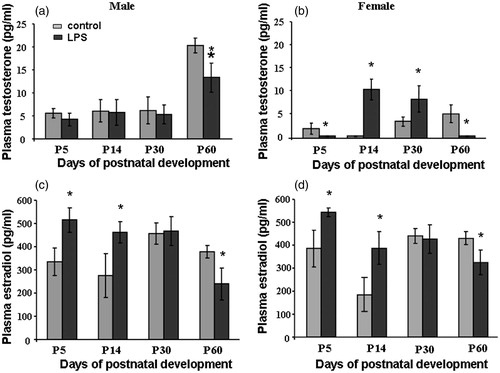
Figure 4. Concentrations of (a, b) free testosterone (pg/ml) and (c, d) estradiol (pg/ml) in male (a, c) and female (b, d) rat offspring at P5, P14, P30, and P60 after saline (control) or lipopolysaccharide (LPS) (18 μg/kg, i.p. at E12) administration to the mother on day 12 of pregnancy, data are M ± SD, (n = 10 per group). Statistical analysis: two-way ANOVA (details in “Results” text), followed by one-way analysis of differences at each time point of development by Tukey’s post hoc test. *p < 0.01 between groups at same age.