Figures & data
Figure 1 Plasma ACTH and corticosterone concentrations: chronic stress with intact salivary glands. (a) Plasma ACTH; (b) plasma corticosterone concentrations, in terminal cardiac puncture blood samples. Control: no stress; Chronic stress: after daily 12 h restraint stress for 22 days; Sham: sham sialoadenectomy. Values are mean ± SEM; n = 12 rats in each group. **p < 0.01, ANOVA/Tukey's.
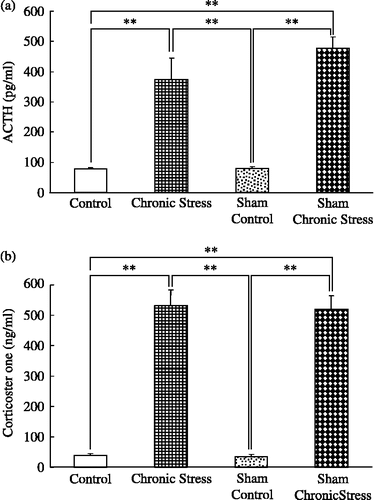
Figure 2 BDNF mRNA quantification in rat submandibular glands and chronic stress. Data are BDNF/β-actin mRNA ratios. Control: no stress; Chronic stress: after daily 12 h restraint stress for 22 days; Sham: sham sialoadenectomy. Values are mean ± SEM; n = 12 rats in each group. **p < 0.01, ANOVA/Tukey's.
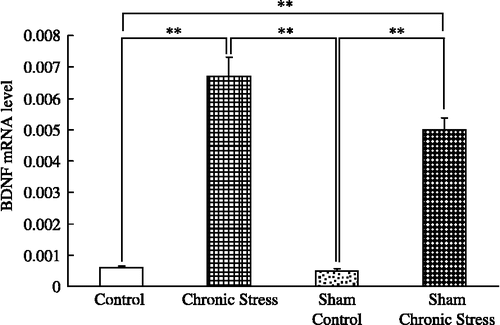
Figure 3 Submandibular gland extract BDNF content and chronic stress. Data are BDNF concentrations in tissue extracts. Control: no stress; Chronic stress: after daily 12 h restraint stress for 22 days; Sham: sham sialoadenectomy. Values are mean ± SEM; n = 12 rats in each group. **p < 0.01, ANOVA/Tukey's.
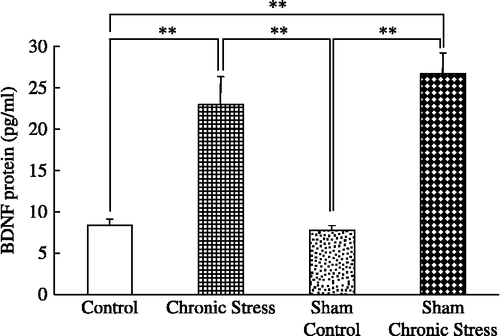
Figure 4 Plasma BDNF concentrations and chronic stress. Data are plasma BDNF concentrations in terminal cardiac puncture blood samples. Control: no stress; Chronic stress: after daily 12 h restraint stress for 22 days; Sham: sham sialoadenectomy. Values are mean ± SEM; n = 12 rats in each group. **p < 0.01, ANOVA/Tukey's.
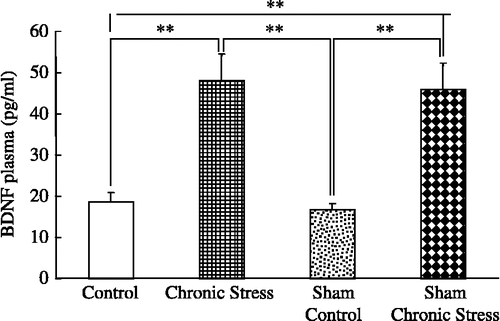
Figure 5 BDNF immunohistochemistry in submandibular gland. Photomicrographs show the immunohistochemical localization of BDNF protein, identified with an anti-BDNF monoclonal antibody in paraffin-embedded sections of submandibular gland from: (a) a non-stressed rat: only faint staining was observed; (b)–(f) rats after daily 12 h restraint stress for 22 days: BDNF protein was observed in duct cells, and there was no obvious BDNF expression in acinar cells (arrow) or myoepithelial cells (arrowhead; b). BDNF protein was immunolocalized in the intercalated (c), striated (d), interlobular, intralobular (e), and excretory ducts (f). Scale bars = (a) 500 μm; (b)–(f) 100 μm.
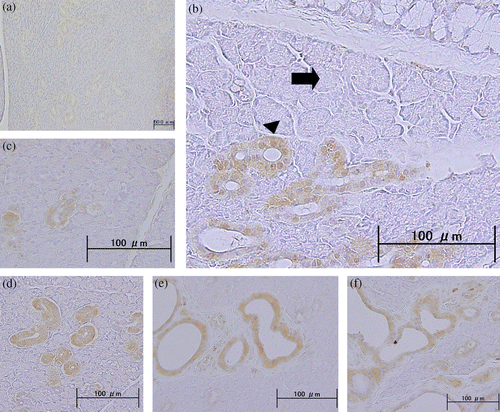
Figure 6 Plasma concentrations of ACTH and corticosterone: chronic stress and sialoadenectomy. (a) Plasma ACTH; (b) Plasma corticosterone concentrations, in terminal cardiac puncture blood samples. Control: no stress; Chronic stress: after daily 12 h restraint stress for 22 days; Sialoadenectomy: removal of submandibular salivary glands; Sham: sham sialoadenectomy. Values are mean ± SEM; n = 12 rats in each group. **p < 0.01, ANOVA/Tukey's. Note: the data for the Sham groups are the same as in .
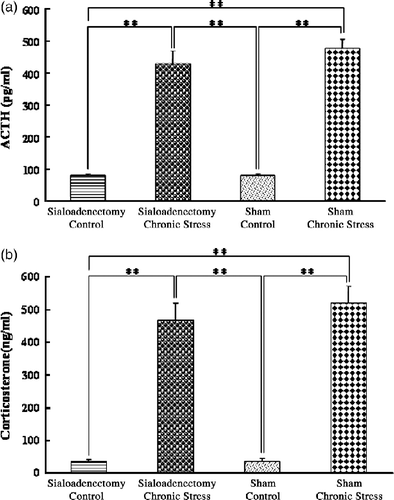
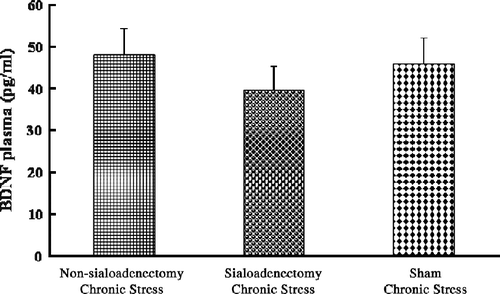
Figure 7 Plasma BDNF concentrations: chronic stress and sialoadenectomy. Data are terminal plasma BDNF concentrations in cardiac puncture blood samples. Chronic stress: after daily 12 h restraint stress for 22 days; Non-sialoadenectomy: no surgery; Sialoadenectomy: removal of submandibular salivary glands before chronic stress; Sham: sham sialoadenectomy before stress. Values are mean ± SEM; n = 12 rats in each group. There were no significant differences among groups (p>0.05).