Figures & data
Figure 1 Recording from one rat illustrating the effect of acute restraint stress on pulsatile arterial pressure (PAP), MAP and HR. Note the sustained arterial pressure and HR increase during the entire restraint period.
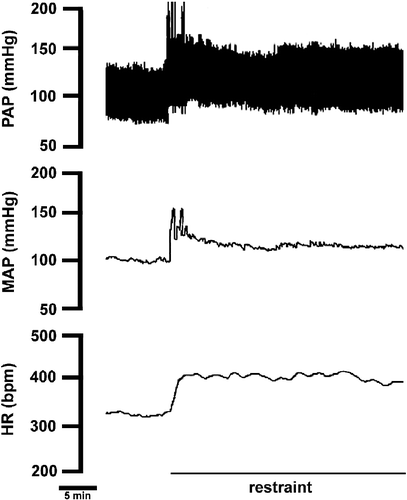
Figure 2 (A) Sigmoid baroreflex curves (n = 6) correlating changes in mean arterial pressure (ΔMAP) and heart rate (ΔHR) of responses before (control, ○; r2 = 0.80) or during (restraint, •; r2 = 0.86) acute restraint stress. Symbols indicate the curve BP50. (B) Baroreflex linear regression curves (n = 6) correlating ΔMAP and ΔHR of control (dashed lines) or restraint (solid lines) groups. Correlation r2 values for bradycardiac regression curves were 0.65 for control and 0.78 for restraint. Correlation r2 values for tachycardiac regression curves were 0.50 for control and 0.59 for restraint. (C) Sigmoid baroreflex curves (n = 6) correlating absolute values of MAP and HR of control (○; r2 = 0.65) and restraint (•; r2 = 0.76) groups. Symbols indicate the curve BP50. (D) Linear regression curves (n = 6) correlating absolute values of MAP and HR for infusion of SNP (▪) and phenylephrine (Phenyl, ○) of control (dashed lines) and restraint (solid lines) groups. Correlation r2 values for bradycardiac regression curves were 0.60 for control and 0.68 for restraint. Correlation r2 values for tachycardiac regression curves were 0.50 for control and 0.55 for restraint. One-way ANOVA followed by Bonferroni's post-test was used to compare differences in cardiac baroreflex responses (See Results): Restraint stress increased the tachycardiac baroreflex response and evoked a rightward displacement in the bradycardiac response, P < 0.005.
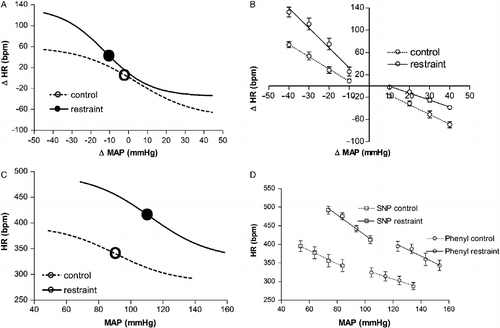
Table I. Parameters derived from sigmoidal baroreflex curves constructed using MAP and HR changes.
Table II. Parameters derived from sigmoidal baroreflex curves constructed using absolute values of MAP and HR.
Figure 3 (A) Sigmoid baroreflex curves (n = 6) correlating changes in mean arterial pressure (ΔMAP) and heart rate (ΔHR) of responses before (control, ▪; r2 = 0.80) or 30 (30 min after, •; r2 = 0.76) and 60 min after (60 min after, ○; r2 = 0.86) ending acute restraint stress. Symbols indicate the curve BP50. (B) Linear regression curves (n = 6) correlating ΔMAP and ΔHR of control (dotted lines) or 30 min after (solid lines) and 60 min after (dashed lines) groups. Correlation r2 values for bradycardiac regression curves were 0.65 for control and 0.78 or 0.64, respectively, 30 and 60 min after ending restraint. Correlation r2 values for tachycardiac regression curves were, respectively, 0.50 for control and 0.59 or 0.78 at 30 or 60 min after ending restraint. (C) Sigmoid baroreflex curves (n = 6) correlating absolute values of MAP and HR of control (▪; r2 = 0.70), 30 min after (•; r2 = 0.65) and 60 after (○; r2 = 0.58) groups. Symbols indicate the curve BP50. (D) Linear regression curves (n = 6) correlating absolute values of MAP and HR for infusion of SNP (▪) and phenylephrine (Phenyl, ○) of control (dotted lines), 30 min after (solid lines) and 60 min after (dashed lines) groups. Correlation r2 values for bradycardiac regression curves were 0.69 for control and 0.68 or 0.54, respectively, 30 and 60 min after ending restraint. Correlation r2 values for tachycardiac regression curves were, respectively, 0.53 for control and 0.67 or 0.68 at 30 or 60 min after ending restraint. One-way ANOVA followed by Bonferroni's post-test was used to compare differences in cardiac baroreflex responses (See Results): restraint-evoked baroreflex changes were still observed at 30 min of the recovery period (P < 0.05), and had returned to control values at 60 min of the recovery period (P>0.05).
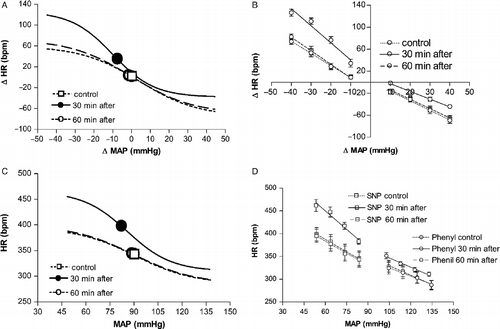
Figure 4 Typical recording from one representative rat illustrating reflex bradycardia in response to a blood pressure increase caused by intravenous phenylephrine (phenyl) infusion before, during (Restraint) or 30 min after ending (30 min after restraint) the acute restraint stress. Vertical lines (a) indicate an increase of 10 mmHg in MAP and the corresponding reflex bradycardia showing rightward displacement of the response during and 30 min after acute restraint stress. PAP, pulsatile arterial pressure and HR, heart rate.
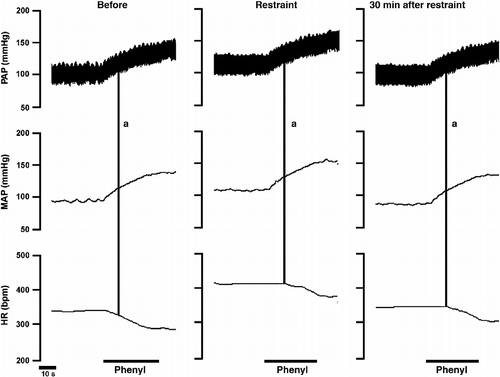
Figure 5 Typical recording from one representative rat illustrating reflex tachycardia in response to blood pressure decreases caused by intravenous SNP infusion before, during (Restraint) or 30 min after ending (30 min after restraint) the acute restraint stress. PAP, pulsatile arterial pressure; MAP, mean arterial pressure; HR, heart rate.
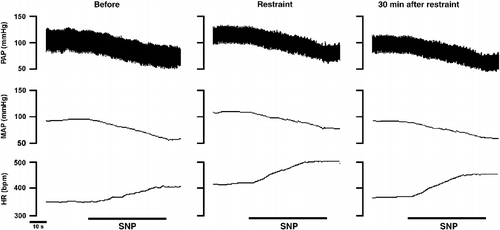
Figure 6 Scatter plot of MAP–HR data from one representative rat before (control) or during acute restraint stress (restraint) measured during phenylephrine (Phenyl, ○) and SNP (▪) infusions, with the fitted sigmoid curves (control: r2 = 0.97; restraint: r2 = 0.95). Curves were constructed by plotting the HR value observed at each subsequent 5 mmHg of increase or decrease in MAP.
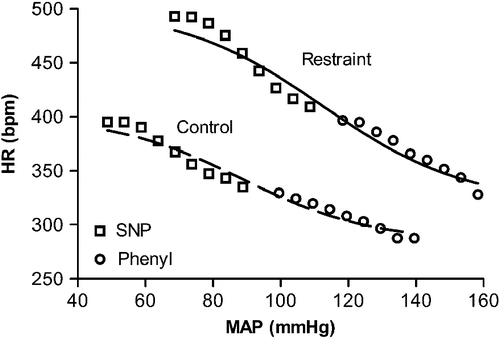
Figure 7 (A) Sigmoid baroreflex curves (n = 5) correlating changes in MAP (ΔMAP) and HR (ΔHR) of responses before (control, ▪; r2 = 0.78) or after intravenous treatment with the selective β1-adrenoceptor antagonist atenolol (control + atenolol, ○; r2 = 0.81) and during restraint stress in atenolol-treated rats (restraint + atenolol, •; r2 = 0.80). Symbols indicate the curve BP50. (B) Linear regression curves (n = 5) correlating ΔMAP and ΔHR of control (dotted lines), control + atenolol (dashed lines) and restraint + atenolol (solid lines) groups. Correlation r2 values for bradycardiac regression curves were 0.69 for control; 0.75 for control + atenolol and 0.74 for restraint + atenolol. Correlation r2 values for tachycardiac regression curves were, 0.50 for control; 0.59 for control + atenolol and 0.78 for restraint + atenolol. One-way ANOVA followed by Bonferroni's post-test was used to compare differences on cardiac baroreflex response in atenolol-treated rats (See Results): Restraint stress evoked a rightward displacement of the bradycardiac response (P < 0.005) with no changes in the tachycardiac baroreflex response in atenolol-treated rats.
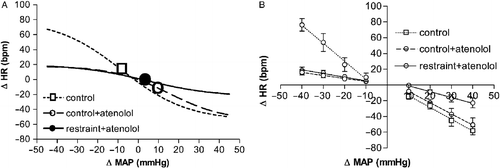
Table III. Parameters derived from sigmoidal baroreflex curves constructed using MAP and HR changes in atenolol-treated animals.
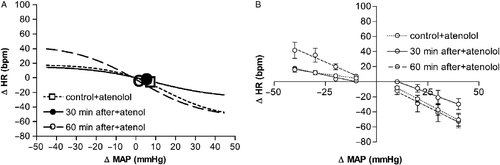
Figure 8 (A) Sigmoid baroreflex curves (n = 5) correlating changes in MAP (ΔMAP) and HR (ΔHR) in rats treated intravenously with the selective β1-adrenoceptor antagonist atenolol before (control + atenolol, ▪; r2 = 0.71) or 30 (30 min after + atenolol, •; r2 = 0.79) and 60 min after (60 min after + atenolol, ○; r2 = 0.82) ending the acute restraint stress. Symbols indicate the curve BP50. (B) Linear regression curves (n = 5) correlating ΔMAP and ΔHR in atenolol-treated rats of control + atenolol (dotted lines), 30 min after + atenolol (solid lines) and 60 min after + atenolol (dashed lines) groups. Correlation r2 values for bradycardiac regression curves were 0.69 for control + atenolol and 0.88 or 0.75, respectively, 30 and 60 min after ending restraint. Correlation r2 values for tachycardiac regression curves were, 0.72 for control + atenolol and 0.79 or 0.86 at 30 or 60 min after ending restraint. One-way ANOVA followed by Bonferroni's post-test was used to compare differences in cardiac baroreflex responses (See Results): restraint-evoked baroreflex changes in atenolol-treated rats were still observed at 30 min of the recovery period (P < 0.05), and had returned to control values at 60 min of the recovery period (P>0.05).