Figures & data
Table I. Rats' body weight and plasma CST levels.
Figure 1 Working memory [(number of food rewarded visits/number of visits and revisits to the baited set of holes) × 100] and reference memory [(number of visits and revisits to the baited set of holes/number of visits and revisits to all holes) × 100] ratios were determined at the beginning and after the end of the CST-treatment and were calculated according to van der Staay et al. (Citation1990). T1, before daily injections (n = 24), T2, after 60 days of daily injections (n = 8 per group). CST, corticosterone treatment. Data are expressed as mean ± SD. Significant differences (p < 0.05): *between CST-/placebo-treated and control groups (p = 0.008); #between the CST-group at T2 as compared to T1 (p = 0.018).
![Figure 1 Working memory [(number of food rewarded visits/number of visits and revisits to the baited set of holes) × 100] and reference memory [(number of visits and revisits to the baited set of holes/number of visits and revisits to all holes) × 100] ratios were determined at the beginning and after the end of the CST-treatment and were calculated according to van der Staay et al. (Citation1990). T1, before daily injections (n = 24), T2, after 60 days of daily injections (n = 8 per group). CST, corticosterone treatment. Data are expressed as mean ± SD. Significant differences (p < 0.05): *between CST-/placebo-treated and control groups (p = 0.008); #between the CST-group at T2 as compared to T1 (p = 0.018).](/cms/asset/8aaf4c2a-1e51-4f20-8a93-420e91926be9/ists_a_408210_f0001_b.gif)
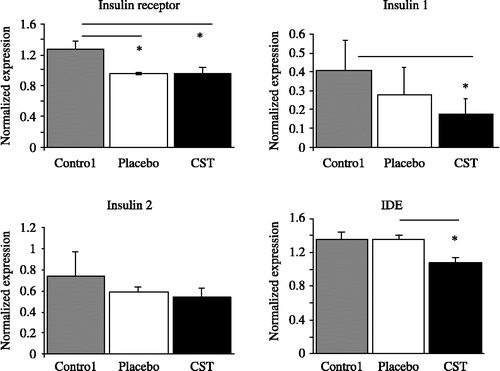
Figure 2 Normalized mRNA expression (means and SEM) for IR, insulin (ins) 1, insulin 2, and IDE in the cortex of CST-treated rats, vehicle-treated placebo rats (injection-stress group) and untreated control (stress-free group). Kruskal–Wallis ANOVA test, *p < 0.05, n = 8 per group. p(IR) = 0.025, p(Ins1) = 0.032, p(IDE) = 0.05.

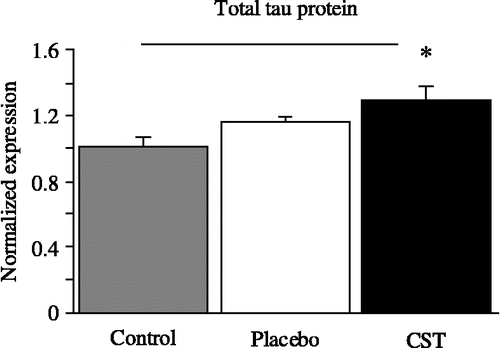
Figure 3 Normalized total mRNA expression (means and SEM) for tau protein in rat cortex after 60 days of CST treatment as compared to vehicle-treated placebo rats (injection-stress group) and untreated control. Kruskal–Wallis ANOVA test *p < 0.05, n = 8 per group, p = 0.034.
