Figures & data
Table 1. Biomonitoring common criteria.
Figure 1. (A) Benzene ambient air concentrations in the USA, HEI (Citation2007). Reprinted with permission from the Health Effects Institute, Boston, MA. (B) Benzene ambient air concentrations in European metropolitan areas. Adapted from Bruinen de Bruin et al. (Citation2008) with kind permission from Springer Science + Business Media.
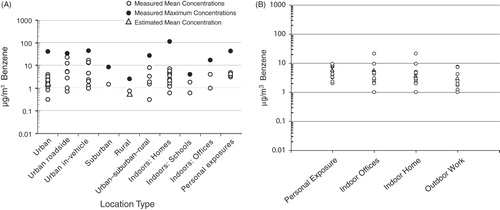
Figure 2. A schematic of liver metabolism of benzene. From Boogaard (Citation2009); reproduced with permission of John Wiley & Sons Ltd. EH, epoxide hydrolase; GSH, glutathione; GST, glutathione-S-transferase; DHDH, dihydrodiol dehydrogenase; MPO, myeloperoxidase; NQO1, NADPH quinone oxidoreductase 1.
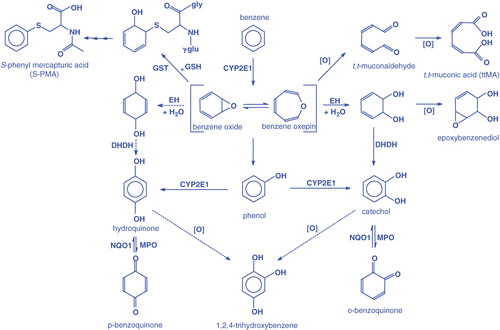
Table 2. Human PBPK model parameters for benzene (reproduced from Brown et al. (Citation1998) with permission from John Wiley & Sons).
Table 3. Suitability of benzene biomarkers of exposure.
Table 4. Non-benzene sources of benzene urinary metabolites.
Table 5. Air exposure levels corresponding to toxicological endpoints for the general public.
Table 6. Published regression models comparing airborne benzene concentrations with urinary benzene and SPMA concentrations.
Table 7. CDC biomonitoring data for benzene in blood (ng/L).
Figure 3. Reported blood benzene concentrations (central tendency) for the general population compared to the benzene biomonitoring equivalent value based upon USEPA non-cancer and cancer benchmarks. Each bar represents a separate exposure population.
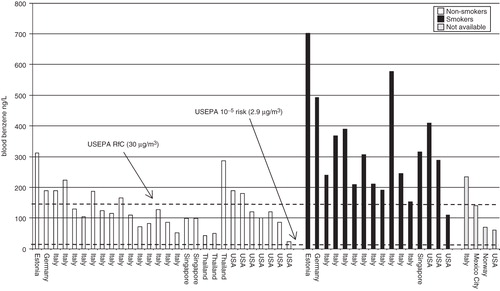
Figure 4. Reported urinary benzene concentrations (central tendency) for the general population compared to the urinary concentration related to USEPA non-cancer and cancer benchmarks. Each bar represents a separate exposure population.
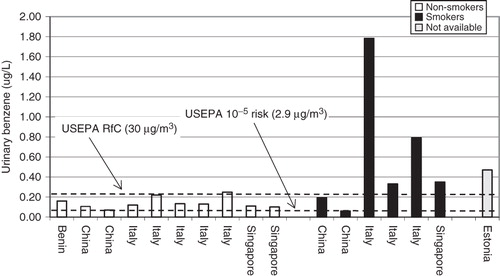
Figure 5. Reported urinary SPMA concentrations (central tendency) for the general population compared to the urinary concentration related to USEPA non-cancer and cancer benchmarks. Each bar represents a separate exposure population. NA = North America and ND = not defined.
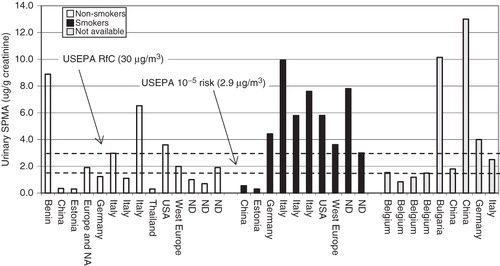
Figure 6. Reported urinary SPMA concentrations (central tendency) for urban workers compared to the ACGIH BEI. Each bar represents a separate exposure population. ND = not definded.
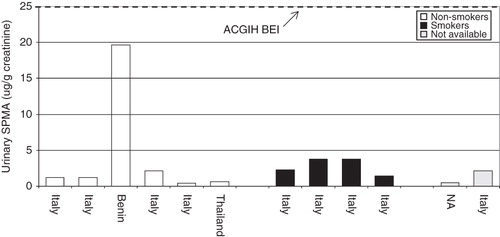
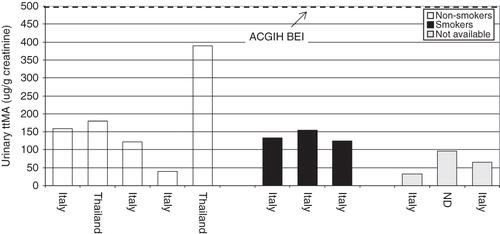
Figure 7. Reported urinary ttMA concentrations (central tendency) for urban workers compared to the ACGIH BEI. Each bar represents a separate exposure population. ND = not definded.