
Figures & data
Figure 1. Approach to the identification of studies relevant to Part 1: Estimation of differential response factors on the basis of tests on healthy and asthmatic subjects under the same conditions. Relevant studies were identified from risk assessment documents and a computerized search of the peer-reviewed literature. All studies found were characterized () and found to fulfill our criteria for quality (). Data concerning the total number of chemicals, mixtures and studies were then used as basis to estimate differential response factors.
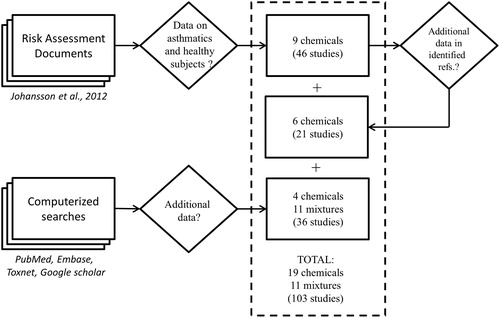
Table 1. Characterization of the three parts of the present study.
Table 2. The criteria for quality applied.
Figure 2. Approach to the identification of studies for Part 2: Comparative analysis of concentration–response relationships. Studies on healthy or asthmatic subjects exposed to nitrogen dioxide, ozone, sulfuric acid or sulfur dioxide were extracted from risk assessment documents and a computerized search of the peer-reviewed literature. All of these studies were characterized () and found to fulfill our criteria for quality (). The studies concerning data on SRaw or FEV1 were selected for this analysis.
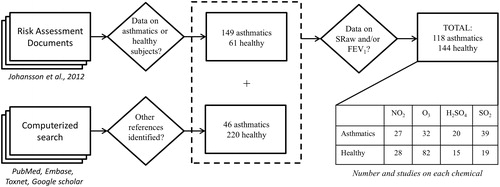
Table 3. Relative response by asthmatic versus healthy subjects to inhalation exposure, expressed as an overall EDRFTable Footnotea.
Figure 3. Percentage change (after/before exposure × 100) in FEV1 and SRaw in healthy and asthmatic subjects following exposure by inhalation (oronasal breathing) to nitrogen dioxide during exercise. Each dot represents the mean response of all subjects in a particular experiment or level of exposure.
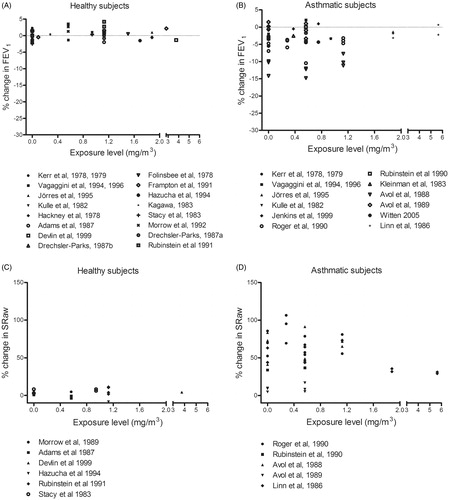
Figure 4. Percentage change (after/before exposure × 100) in FEV1 in healthy and asthmatic subjects following inhalation exposure (mouth-only breathing) to nitrogen dioxide during exercise. Each dot represents the mean response of all subjects in a particular experiment or level of exposure.
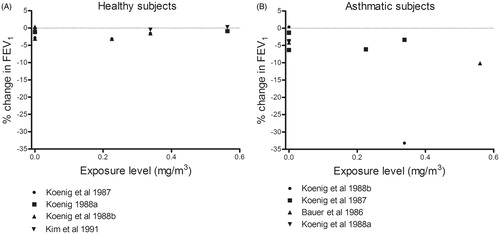
Figure 5. Percentage change (after/before exposure × 100) in FEV1 and SRaw in healthy and asthmatic subjects following exposure by inhalation (oronasal breathing) to ozone during exercise. Each dot represents the mean response of all subjects in a particular experiment or level of exposure.
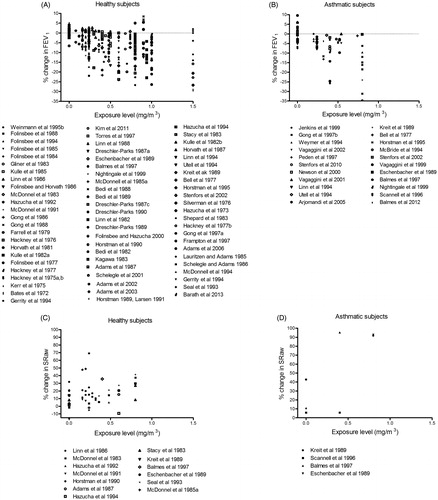
Figure 6. Percentage change (after/before exposure × 100) in FEV1 in healthy and asthmatic subjects following inhalation exposure (mouth-only breathing) to ozone during exercise. Each dot represents the mean response of all subjects in a particular experiment or level of exposure.
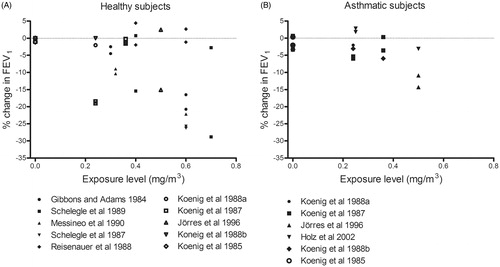
Figure 7. Percentage change (after/before exposure × 100) in FEV1 and SRaw in healthy and asthmatic subjects following exposure by inhalation (oronasal breathing) to sulfuric acid during exercise. Each dot represents the mean response of all subjects in a particular experiment or level of exposure.
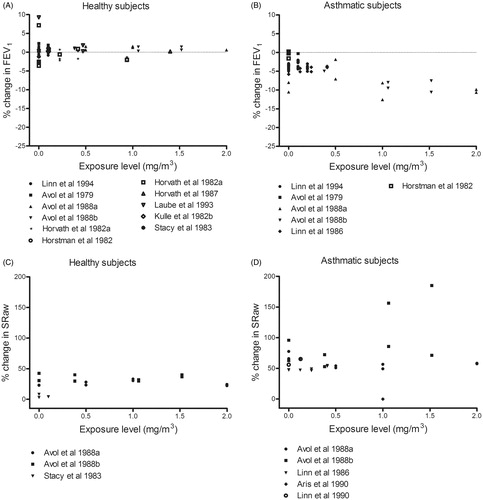
Figure 8. Percentage change (after/before exposure × 100) in FEV1 in healthy and asthmatic subjects following inhalation exposure (mouth-only breathing) to sulfuric acid during exercise. Each dot represents the mean response of all subjects in a particular experiment or level of exposure.
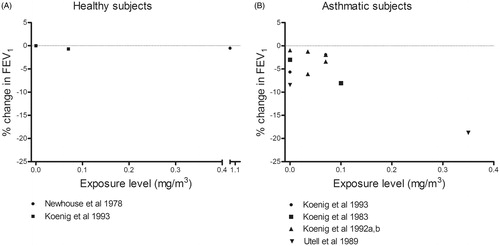
Figure 9. Percentage change (after/before exposure × 100) in FEV1 and SRaw in healthy and asthmatic subjects following exposure by inhalation (oronasal breathing) to sulfur dioxide during exercise. Each dot represents the mean response of all subjects in a particular experiment or level of exposure.
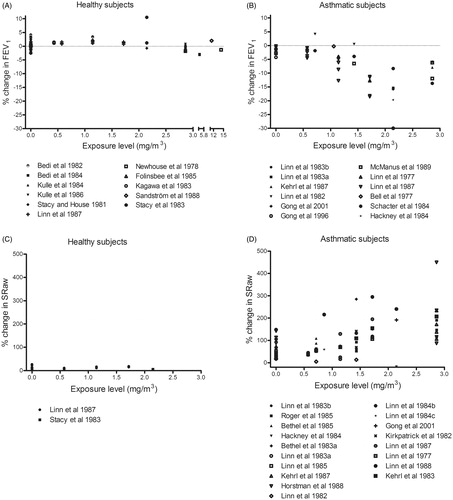
Figure 10. Percentage change (after/before exposure × 100) in FEV1 in healthy and asthmatic subjects following inhalation exposure (mouth-only breathing) to sulfur dioxide during exercise. Each dot represents the mean response of all subjects in a particular experiment or level of exposure.
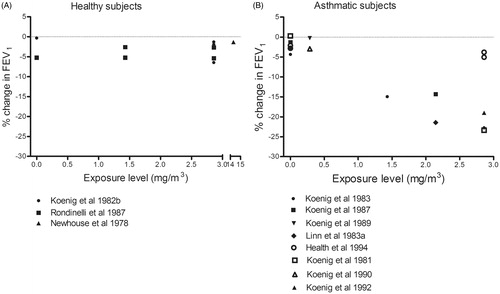
Figure 11. Benchmark concentration analysis of the increase in SRaw following exposure by inhalation to various levels of sulfur dioxide (in a chamber with a noseclip at rest). The upper and lower curves represent the best fits to the experimental data for asthmatics (Δ), and healthy subjects (o), respectively. The larger symbols depict mean values.
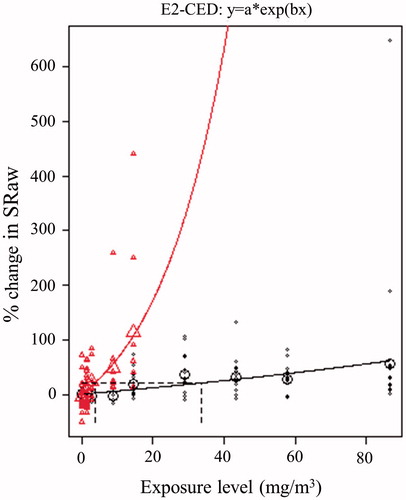
Table 4. Comparison of our findings to a previous assessment of differences in the responses of asthmatic and healthy subjects to irritant gases.