
Figures & data
Figure 1. Genes differentially expressed between diagnosis and relapse of CN AML. Log2 fold changes compared to the mean of all samples are displayed for the 30 most up- and the 30 most down-regulated genes (i.e. significantly differentially expressed genes with the highest positive and negative mean log2 fold changes between the two disease states). Red, gene expression above the mean; blue, gene expression below the mean. DG, diagnosis; R, relapse.
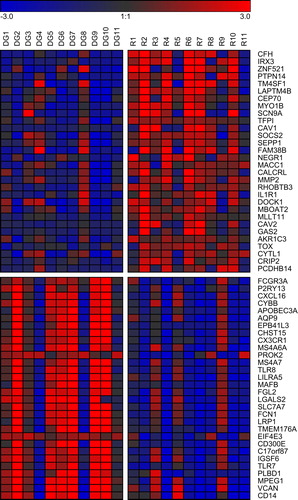
Figure 2. Gene signatures associated with LSCs, HSCs and poor therapy response are enriched in the CN AML relapse profile. Lists of genes associated with functionally defined LSCs [Citation7], cell surface marker-defined HSCs [Citation7], poor response to chemotherapy [Citation10–12] or marker-defined LSCs [Citation9] were probed against the relapse-associated gene expression profile, ranked according to each gene's associated t-statistic, using gene set enrichment analysis (GSEA) [Citation8]. The number of genes present in the relapse profile, as well as the total number of genes, is indicated for each signature. NES, normalized enrichment score; FDR, false discovery rate. Similar results were obtained when genes were ranked according to their log2 fold change between the two disease states.
![Figure 2. Gene signatures associated with LSCs, HSCs and poor therapy response are enriched in the CN AML relapse profile. Lists of genes associated with functionally defined LSCs [Citation7], cell surface marker-defined HSCs [Citation7], poor response to chemotherapy [Citation10–12] or marker-defined LSCs [Citation9] were probed against the relapse-associated gene expression profile, ranked according to each gene's associated t-statistic, using gene set enrichment analysis (GSEA) [Citation8]. The number of genes present in the relapse profile, as well as the total number of genes, is indicated for each signature. NES, normalized enrichment score; FDR, false discovery rate. Similar results were obtained when genes were ranked according to their log2 fold change between the two disease states.](/cms/asset/a5e355bf-28b6-4972-901a-dbb10c648420/ilal_a_944523_f0002_oc.jpg)