Figures & data
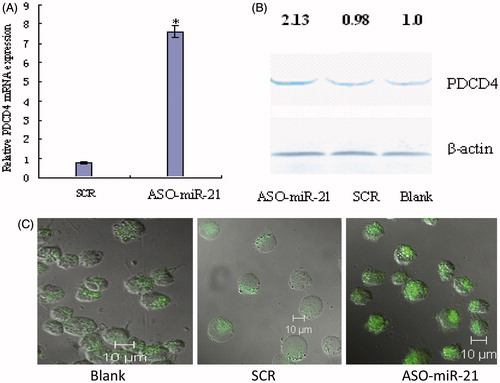
Figure 5. ASO-miR-21 up-regulation of PDCD4 mRNA and protein levels. K562 cells were transfected with 0.4 μM ASO-miR-21 and harvested 48 h after transfection. Total RNA was isolated and analyzed for PDCD4 mRNA. PDCD4 protein level was determined by fluorescence immunohistochemistry and Western blot. (A) PDCD4 mRNA relative expression level by SYBR-Green real-time PCR. *p < 0.01, as compared with controls. (B) PDCD4 protein expression level by Western blot. *p < 0.01, as compared with controls. (C) PDCD4 protein expression level by confocal microscopy.