Figures & data
Figure 1. A schematic representation of the structure of the CFTR protein. The protein consists of five domains: two transmembrane domains (TMD1 and TMD2), two nucleotide-binding domains (NBD1 and NBD2), and a regulatory domain (RD).
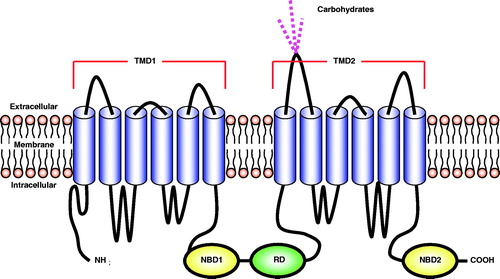
Table 1. Classification of CFTR mutations*.
Figure 2. Development and progression of the pulmonary form of cystic fibrosis. Lung manifestations are the primary cause of morbidity and mortality in patients. Modified from Ref. [Citation3].
![Figure 2. Development and progression of the pulmonary form of cystic fibrosis. Lung manifestations are the primary cause of morbidity and mortality in patients. Modified from Ref. [Citation3].](/cms/asset/4dd55c24-db13-473d-8566-35a61cc3f25d/idrt_a_829078_f0002_b.jpg)
Table 2. Viral vectors studied for gene therapy of cystic fibrosis [Citation36].
Figure 3. Transport mode distributions of adenovirus (AdV) adeno-associated virus (AAV5, serotype 5), muco-adhesive PS control nanoparticles (PS) and muco-inert control PS-PEG nanoparticles. Particles were classified into either (i) immobile or hindered and (ii) diffusive. Mean ± SD are shown. *Statistically significant difference when compared with AAV5, AdV or PS within the same transport mode classification (p < 0.05). Redrawn using data from Ref. [Citation41].
![Figure 3. Transport mode distributions of adenovirus (AdV) adeno-associated virus (AAV5, serotype 5), muco-adhesive PS control nanoparticles (PS) and muco-inert control PS-PEG nanoparticles. Particles were classified into either (i) immobile or hindered and (ii) diffusive. Mean ± SD are shown. *Statistically significant difference when compared with AAV5, AdV or PS within the same transport mode classification (p < 0.05). Redrawn using data from Ref. [Citation41].](/cms/asset/83bc823e-e74b-4e20-a40e-0139bd16fca4/idrt_a_829078_f0003_b.jpg)
Figure 4. Determination of transduced cell types. The transduced green fluorescent protein (GFP)-positive cells were identified using fluorescent microscopy (original magnification × 63) 30 d after administration of SIV-GFP (4 × 10⁸ TU/mouse) vector to the mouse nose. (A) Ciliated respiratory epithelial cell, (B) neuronal cell in olfactory epithelium, (C) squamous epithelial cell and (D) non-neuronal cell in olfactory epithelium. The central image shows a cross-section through the mouse nose and red boxes indicate regions in mouse nasal epithelium where respective transduced cell types were found. Panels A, B and D were rotated ∼45°, 130° and 180° counter clockwise, respectively, to improve clarity of the figure. Modified from Ref. [Citation42].
![Figure 4. Determination of transduced cell types. The transduced green fluorescent protein (GFP)-positive cells were identified using fluorescent microscopy (original magnification × 63) 30 d after administration of SIV-GFP (4 × 10⁸ TU/mouse) vector to the mouse nose. (A) Ciliated respiratory epithelial cell, (B) neuronal cell in olfactory epithelium, (C) squamous epithelial cell and (D) non-neuronal cell in olfactory epithelium. The central image shows a cross-section through the mouse nose and red boxes indicate regions in mouse nasal epithelium where respective transduced cell types were found. Panels A, B and D were rotated ∼45°, 130° and 180° counter clockwise, respectively, to improve clarity of the figure. Modified from Ref. [Citation42].](/cms/asset/bf741798-ca71-4992-a03d-e25d19478255/idrt_a_829078_f0004_b.jpg)
Figure 5. Duration of green fluorescent protein (GFP) expression after transduction with F/HN-SIV-GFP. Mouse nasal tissue was perfused with SIV-GFP (4 × 10⁸ TU/mouse or phosphate-buffered saline (PBS) and gene expression was analyzed at indicated time points after transduction. GFP-positive cells were quantified on histological sections taken 2 mm into the nasal tissue of the nose. Data from 30 to 360 d after transduction are represented both by mean ± SEM and individual values (ratio to GFP cells positive on day 30). The number (n) per group are 13 (day 30), 3 (day 50), 12 (day 90), 14 (day 160–180), 10 (day 220–270) and 17 (day 360) [Citation42].
![Figure 5. Duration of green fluorescent protein (GFP) expression after transduction with F/HN-SIV-GFP. Mouse nasal tissue was perfused with SIV-GFP (4 × 10⁸ TU/mouse or phosphate-buffered saline (PBS) and gene expression was analyzed at indicated time points after transduction. GFP-positive cells were quantified on histological sections taken 2 mm into the nasal tissue of the nose. Data from 30 to 360 d after transduction are represented both by mean ± SEM and individual values (ratio to GFP cells positive on day 30). The number (n) per group are 13 (day 30), 3 (day 50), 12 (day 90), 14 (day 160–180), 10 (day 220–270) and 17 (day 360) [Citation42].](/cms/asset/274a8ec4-5f54-4ec9-a7b9-22f1e04bc9cc/idrt_a_829078_f0005_b.jpg)
Figure 6. The combination of cationic liposome (GL67A) and plasmid DNA expressing CFTR (pGM169). (A) pGM169 plasmid encoding the gene for CFTR protein contains no CpG dinucleotides, which are unmethylated in bacterial derived plasmids and induce inflammatory response. The plasmid also includes a CMV promoter, which aids in increased gene expression. (B) Electron microscope image of pGM169-GL67A liposomal complex. Modified from http://www.genemedresearch.ox.ac.uk/ukcfgtc/product.html.
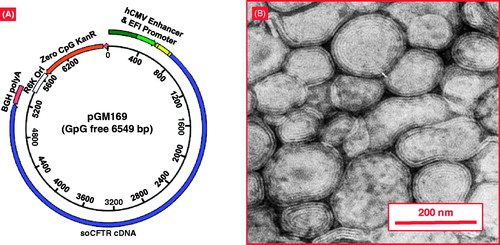
Figure 7. Behavior of mucoadhesive and muco-inert particles in mucus layers. Muco-inert particles do not possess any attractive forces with CF mucus like mucoadhesive conventional particles and therefore have greater penetration. Muco-inert particles present as an optimal option for inhalation delivery for patients with cystic fibrosis. Modified from Ref. [Citation43].
![Figure 7. Behavior of mucoadhesive and muco-inert particles in mucus layers. Muco-inert particles do not possess any attractive forces with CF mucus like mucoadhesive conventional particles and therefore have greater penetration. Muco-inert particles present as an optimal option for inhalation delivery for patients with cystic fibrosis. Modified from Ref. [Citation43].](/cms/asset/5badf58c-1f02-45ca-95c6-04731df03803/idrt_a_829078_f0007_b.jpg)
Figure 8. Penetration of polystyrene 200 nm nanoparticles through CF sputum. Polystyrene nanoparticles densely coated with low MW PEG (PS-PEG) have greater penetration through CF sputum compared to non-PEGylated particles (PS). Treatment with N-acetyl cysteine (NAC) increases penetration of both coated and non-coated particles. Mean ± SD are shown. Redrawn using data from Ref. [Citation60].
![Figure 8. Penetration of polystyrene 200 nm nanoparticles through CF sputum. Polystyrene nanoparticles densely coated with low MW PEG (PS-PEG) have greater penetration through CF sputum compared to non-PEGylated particles (PS). Treatment with N-acetyl cysteine (NAC) increases penetration of both coated and non-coated particles. Mean ± SD are shown. Redrawn using data from Ref. [Citation60].](/cms/asset/c640aa34-64a9-472b-b812-993731fc1ecf/idrt_a_829078_f0008_b.jpg)
Figure 9. An influence of mucolytic treatment on the mucus mesh. Treatment with hypertonic saline increases the spacing within the mucus mesh. Treatment with a mucolytic such as N-acetyl cysteine breaks disulfide bonds within the mucosal mesh network. The increase in openings can increase particle penetration [Citation12].
![Figure 9. An influence of mucolytic treatment on the mucus mesh. Treatment with hypertonic saline increases the spacing within the mucus mesh. Treatment with a mucolytic such as N-acetyl cysteine breaks disulfide bonds within the mucosal mesh network. The increase in openings can increase particle penetration [Citation12].](/cms/asset/2c752f06-3461-468b-8f9f-87d604c7ed80/idrt_a_829078_f0009_b.jpg)
Figure 10. Nanomedicine approach for inhalation treatment of pulmonary fibrosis. (A) Nanostructured lipid carrier (NLC)-based drug delivery system (DDS). (B) Structure of liposomal DDS. (C) Installation for inhalation delivery of DDS. (D) NLC particle size distribution by dynamic light scattering. (E) Organ distribution of liposomes after intravenous and inhalation administration. (F) Organ distribution of NLC after intravenous and inhalation administration. (G) Hydroxyproline content in the lungs. Means ± SD are shown. (H) Lung tissue histology. The tissues were stained with eosin-hematoxylin. (I) Survival of experimental animals. Mice were treated with liposomal PGE2 by inhalation twice per week for three weeks starting one day later after the bleomycin administration. *p < 0.05 when compared with control (healthy animals). †p < 0.05 when compared with untreated animals with fibrosis. Modified from Refs. [Citation66,Citation67,Citation70].
![Figure 10. Nanomedicine approach for inhalation treatment of pulmonary fibrosis. (A) Nanostructured lipid carrier (NLC)-based drug delivery system (DDS). (B) Structure of liposomal DDS. (C) Installation for inhalation delivery of DDS. (D) NLC particle size distribution by dynamic light scattering. (E) Organ distribution of liposomes after intravenous and inhalation administration. (F) Organ distribution of NLC after intravenous and inhalation administration. (G) Hydroxyproline content in the lungs. Means ± SD are shown. (H) Lung tissue histology. The tissues were stained with eosin-hematoxylin. (I) Survival of experimental animals. Mice were treated with liposomal PGE2 by inhalation twice per week for three weeks starting one day later after the bleomycin administration. *p < 0.05 when compared with control (healthy animals). †p < 0.05 when compared with untreated animals with fibrosis. Modified from Refs. [Citation66,Citation67,Citation70].](/cms/asset/67cffbaf-4f10-4200-8464-89141aa11b8a/idrt_a_829078_f0010_b.jpg)