Figures & data
Table 1. Characteristics of CF containing liposomes.
Figure 1. (A) Stability of liposomal CF formulations in culture medium at 37 °C. No difference in release was observed between GSH-PEG and PEG liposomes. Release reached a maximum of 0.5 ± 0.1% (GSH-PEG) and 0.4 ± 0.1% (PEG) of the total liposomal CF concentration after 24 h. (B) CF in cell lysates of RBE4 cells treated with liposomes. Liposomal CF levels were measured after release of CF from the liposomes in the lysates using isopropanol.
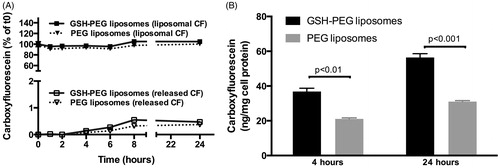
Figure 2. (A) CF signal in RBE4 cells incubated with GSH-PEG liposomes (37 °C). (B) CF in RBE4 cells incubated with PEG liposomes (37 °C). (C) CF in RBE4 cells incubated with GSH-PEG liposomes at 4 °C. Cell nuclei were stained with DAPI.
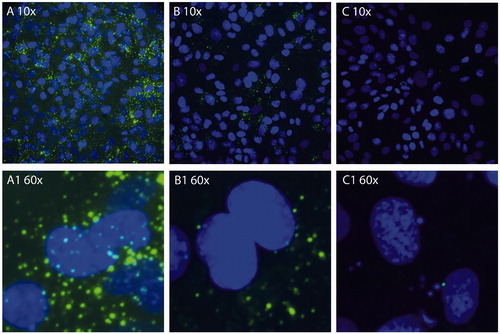
Figure 3. Plasma levels of liposomal CF after IP and IV administration of GSH-PEG liposomes (2.5 mg/kg CF).
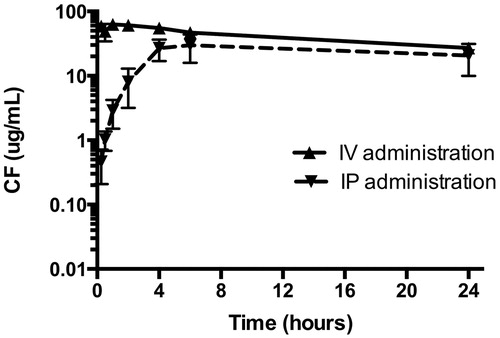
Figure 4. Tissue concentrations of liposomal CF after IV and IP administration of GSH-PEG liposomes (2.5 mg/kg CF). *CF concentration is the amount released from intact liposomes and expressed as ng extracted from 1 mg tissue.
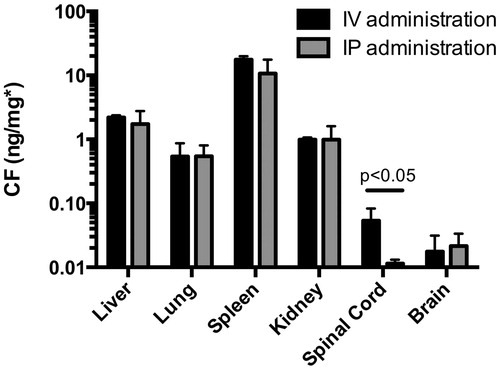
Figure 5. Plasma and brain microdialysate concentrations after IV administration of free CF (5 mg/kg). Two hours after injection of CF fluorescent signal was not detectable in plasma anymore. Fluorescent signal in brain microdialysates remained detectable for at least 4.5 h.
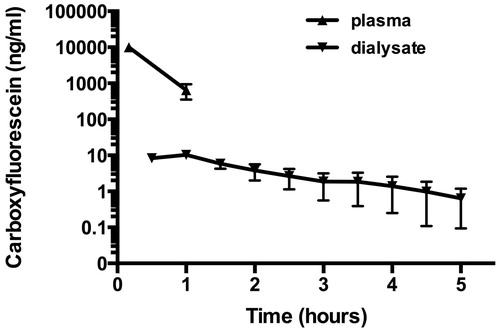
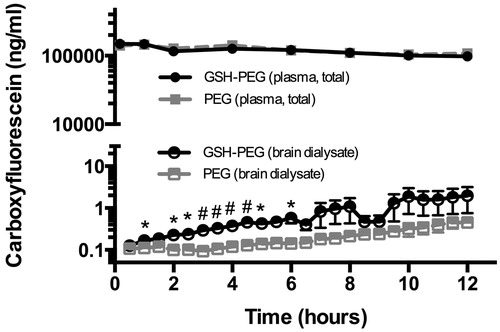
Figure 6. Plasma and brain microdialysate concentrations of CF after IV administration of GSH-PEG and PEG liposomes (7.5 mg/kg CF). Multiple t-tests *p < 0.05 #p < 0.01 GSH-PEG versus PEG.