868
Views
8
CrossRef citations to date
0
Altmetric
Research Article

Chronic Antagonism of the Mineralocorticoid Receptor Ameliorates Hypertension and End Organ Damage in a Rodent Model of Salt-Sensitive Hypertension

, , , , , , , , , , , , & show all
Pages 538-547 | Received 13 Nov 2010, Accepted 03 Jan 2011, Published online: 27 Sep 2011

Figures & data

Figure 1. Effects of chronic eplerenone treatment on BP and heart rate in Dahl SS rats. Data are mean ± SEM (n = 8 for each group). Abbreviations: LS - low salt; HS - high salt; Epl - eplerenone. High salt statistically significantly increased sBP after 1 week of salt-loading (p < 0.05, HS alone vs. LS alone). sBP in LS + Epl 100 mg•kg−1d−1 and HS + Epl 100 mg•kg−1d−1 group was statistically significantly lower than the LS alone (since the first week of treatment) and HS alone group (since the second week of treatment), respectively (p < 0.05). Heart rate was statistically significantly higher in the HS alone group than the other three groups in the last 3 weeks of the study (p < 0.05) (color figure available online).
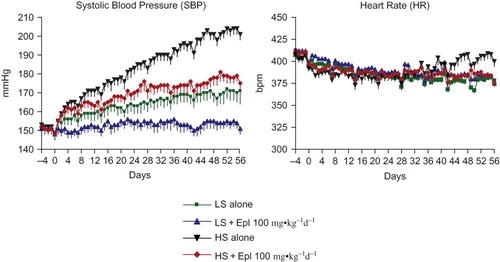
Figure 1. Effects of chronic eplerenone treatment on BP and heart rate in Dahl SS rats. Data are mean ± SEM (n = 8 for each group). Abbreviations: LS - low salt; HS - high salt; Epl - eplerenone. High salt statistically significantly increased sBP after 1 week of salt-loading (p < 0.05, HS alone vs. LS alone). sBP in LS + Epl 100 mg•kg−1d−1 and HS + Epl 100 mg•kg−1d−1 group was statistically significantly lower than the LS alone (since the first week of treatment) and HS alone group (since the second week of treatment), respectively (p < 0.05). Heart rate was statistically significantly higher in the HS alone group than the other three groups in the last 3 weeks of the study (p < 0.05) (color figure available online).

Figure 2. Effects of eplerenone on body weight, food intake, water intake, and urine output in Dahl SS rats. Data are mean ± SEM (n = 8 for each group). Abbreviations: LS - low salt; HS - high salt; Epl - eplerenone. Body weight and food intake were not statistically significantly different among all groups. Water intake and urine output were statistically significantly greater in the two high-salt diet groups than that in the two low-salt diet groups (*p < 0.05, HS groups vs. LS groups) (color figure available online).
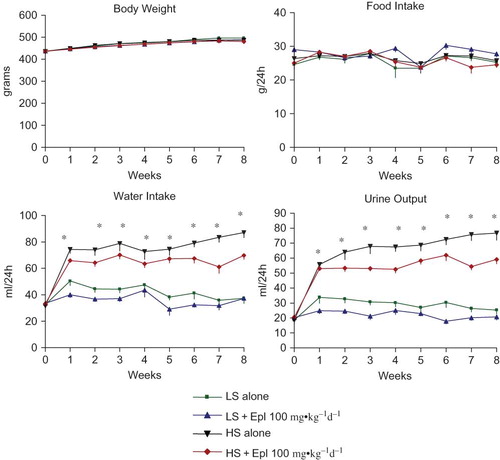
Figure 2. Effects of eplerenone on body weight, food intake, water intake, and urine output in Dahl SS rats. Data are mean ± SEM (n = 8 for each group). Abbreviations: LS - low salt; HS - high salt; Epl - eplerenone. Body weight and food intake were not statistically significantly different among all groups. Water intake and urine output were statistically significantly greater in the two high-salt diet groups than that in the two low-salt diet groups (*p < 0.05, HS groups vs. LS groups) (color figure available online).

Figure 3. Effects of Eplerenone on urinary electrolytes and creatinine excretion in Dahl SS rats. Data are mean ± SEM (n = 8 for each group). Abbreviations: LS - low salt; HS - high salt; Epl - eplerenone. Urinary Na and Cl excretion were statistically significantly greater in the two high-salt diet groups than that in the two low-salt diet groups (*p < 0.05, HS groups vs. LS groups). Urinary K and creatinine excretion were not statistically significantly different among all groups (color figure available online).
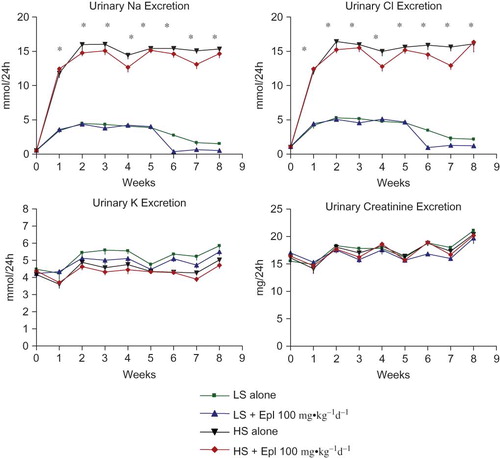
Figure 3. Effects of Eplerenone on urinary electrolytes and creatinine excretion in Dahl SS rats. Data are mean ± SEM (n = 8 for each group). Abbreviations: LS - low salt; HS - high salt; Epl - eplerenone. Urinary Na and Cl excretion were statistically significantly greater in the two high-salt diet groups than that in the two low-salt diet groups (*p < 0.05, HS groups vs. LS groups). Urinary K and creatinine excretion were not statistically significantly different among all groups (color figure available online).

Figure 4. Time course of 24-h urinary protein excretion. Data are mean ± SEM (n = 8 for each group). Abbreviations: LS - low salt; HS - high salt; Epl - eplerenone. Urinary protein excretion was statistically significantly greater in the HS alone group than that in the LS alone group (*p < 0.05, HS alone vs. LS alone). Proteinuria was statistically significantly reduced in the HS + Epl 100 mg•kg−1d−1 group compared with the HS alone group in the 7th and 8th week of the study (p < 0.05, HS + Epl 100 mg•kg−1d−1 vs. HS alone) (color figure available online).

Figure 4. Time course of 24-h urinary protein excretion. Data are mean ± SEM (n = 8 for each group). Abbreviations: LS - low salt; HS - high salt; Epl - eplerenone. Urinary protein excretion was statistically significantly greater in the HS alone group than that in the LS alone group (*p < 0.05, HS alone vs. LS alone). Proteinuria was statistically significantly reduced in the HS + Epl 100 mg•kg−1d−1 group compared with the HS alone group in the 7th and 8th week of the study (†p < 0.05, HS + Epl 100 mg•kg−1d−1 vs. HS alone) (color figure available online).
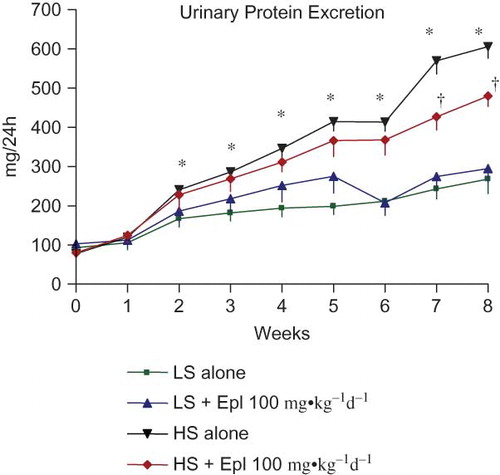
Figure 5. Time course of 24-h urinary kidney injury biomarkers. Data are mean ± SEM (n = 8 for each group). Abbreviations: LS - low salt; HS - high salt; Epl - eplerenone; LPN - lipocalin-2; OPN -osteopontin; KIM-1 -kidney biomarker molecule-1; RPA-1 -renal papillary antigen 1. All these biomarkers were increased as early as 2–4 weeks after salt-loading and were statistically significantly diminished by eplerenone treatment towards the end of the study. (*p < 0.05, HS alone vs. LS alone; p < 0.05, HS + Epl 100 mg•kg−1d−1 vs. HS alone) (color figure available online).

Figure 5. Time course of 24-h urinary kidney injury biomarkers. Data are mean ± SEM (n = 8 for each group). Abbreviations: LS - low salt; HS - high salt; Epl - eplerenone; LPN - lipocalin-2; OPN -osteopontin; KIM-1 -kidney biomarker molecule-1; RPA-1 -renal papillary antigen 1. All these biomarkers were increased as early as 2–4 weeks after salt-loading and were statistically significantly diminished by eplerenone treatment towards the end of the study. (*p < 0.05, HS alone vs. LS alone; †p < 0.05, HS + Epl 100 mg•kg−1d−1 vs. HS alone) (color figure available online).
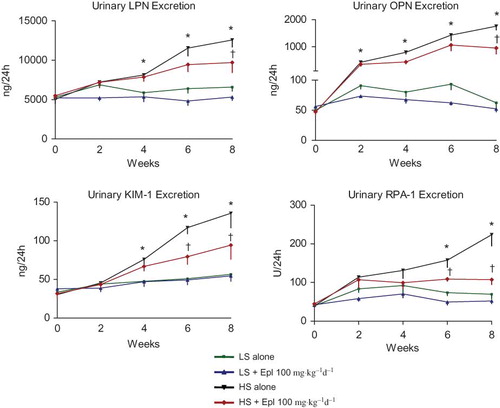
Figure 6. Serum aldosterone level at the end of an 8-week treatment. Data are mean ± SEM (n = 8 for each group). Abbreviations: LS - low salt; HS - high salt; Epl - eplerenone. There was no statistically significant difference in serum aldosterone level among all groups (color figure available online).
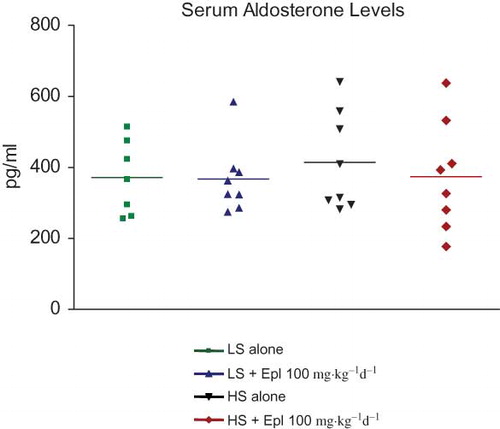
Figure 6. Serum aldosterone level at the end of an 8-week treatment. Data are mean ± SEM (n = 8 for each group). Abbreviations: LS - low salt; HS - high salt; Epl - eplerenone. There was no statistically significant difference in serum aldosterone level among all groups (color figure available online).

Table 1. Plasma creatinine, Na, and K concentration at the end of 8 weeks treatment

Table 2. Plasma eplerenone level at the end of an 8-week treatment

Table 3. Body and organ weights

Table 4. Renal histopathologic scores

Figure 7. Representative light microscopic findings in glomeruli, renal tubules, interstitium, and vasculature. Upper panel: HS alone, glomerulus, renal tubules, interstitium, and renal artery (left→right). Lower panel: HS + Epl 100 mg·kg−1d−1, glomerulus, renal tubules, interstitium, and renal artery (left→right). High salt alone group shows excess mesangium and decreased capillary lumen in glomerulus, dilated tubules filled with proteinaceous materials, subendothelial fibrinoid material and endothelial proliferation in renal artery, and interstitium infiltration with mononuclear inflammatory cells. HS + Epl 100 mg·kg−1d−1 group exhibits normal appearance of glomerulus, decreased dilation and proteinaceous content in renal tubules, normal vascular appearance, and no infiltration with mononuclear inflammatory cells in interstitium (color figure available online).
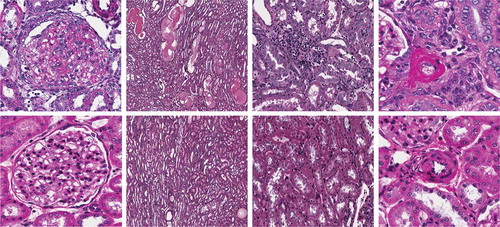
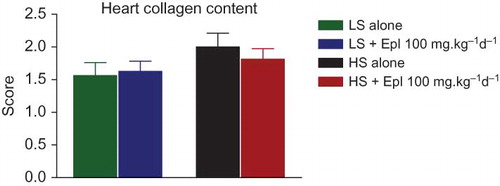
Figure 7. Representative light microscopic findings in glomeruli, renal tubules, interstitium, and vasculature. Upper panel: HS alone, glomerulus, renal tubules, interstitium, and renal artery (left→right). Lower panel: HS + Epl 100 mg·kg−1d−1, glomerulus, renal tubules, interstitium, and renal artery (left→right). High salt alone group shows excess mesangium and decreased capillary lumen in glomerulus, dilated tubules filled with proteinaceous materials, subendothelial fibrinoid material and endothelial proliferation in renal artery, and interstitium infiltration with mononuclear inflammatory cells. HS + Epl 100 mg·kg−1d−1 group exhibits normal appearance of glomerulus, decreased dilation and proteinaceous content in renal tubules, normal vascular appearance, and no infiltration with mononuclear inflammatory cells in interstitium (color figure available online).

Figure 8. Heart collagen content in all groups. Abbreviations: LS - low salt; HS - high salt; Epl - eplerenone. Heart collagen content was not statistically significantly different among all groups (color figure available online).

Figure 8. Heart collagen content in all groups. Abbreviations: LS - low salt; HS - high salt; Epl - eplerenone. Heart collagen content was not statistically significantly different among all groups (color figure available online).