Figures & data
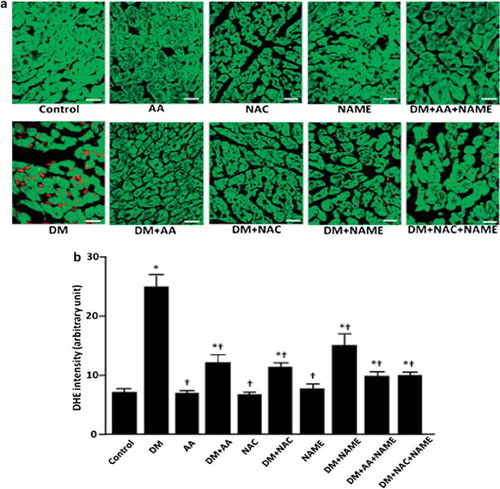
Figure 4. (a) Representative immunohistochemical images of dihydroethidium (DHE) staining. DHE-accumulated nuclei are stained red and cardiomyocytes are stained green. Bars indicate 20 μm. DM, diabetes mellitus; AA, ascorbic acid; NAC, N-acetyl cysteine; NAME, N-ω-nitro-L-arginine methyl ester. (b). Quantitative analysis of DHE staining. Each bar graph indicates mean ± SEM of five experiments. *p < 0.05 vs control, †p < 0.05 vs DM. DM, diabetes mellitus; AA, ascorbic acid; NAC, N-acetyl cysteine; NAME, N-ω-nitro-L-arginine methyl ester.