Figures & data
Figure 1. Decreased parkin ubiquitin E3 ligase activity following MAO-B induction. Inducible MAO-B PC12 cells were stably transfected with human parkin and assessed under both control and dox-induced conditions versus following FCCP treatment. Cell lysates were prepared from cells and immunoprecipitated (IP) using Flag-tagged or parkin antibody. Samples were run in an E3 ligase activity assay followed by analysis via Western blot using parkin and ubiquitin antibodies; β-actin was used as loading control. Corresponding densitometric analyses are shown (n = 3). Values are expressed as mean ± SD; ***p < 0.001 versus parkin–MAO-B cells, **p < 0.01 versus + MAO-B cells.
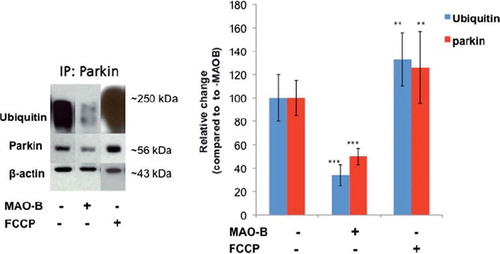
Figure 2. Mitochondrial parkin levels in various conditions. Western blot analyses were performed on mitochondrial sub-fractions from cells in various treatment conditions using Flag or parkin antibodies (Sigma). Immunoblots were normalized for VDAC (Chemicon) for corresponding densitometric analyses (n = 3). Values are expressed as mean ± SD, **p < 0.01 ***p < 0.001 versus –MAO-B cells.
Figure 3. Immunocytochemistry (ICC) analysis of mitochondrial localization of parkin in various conditions. Z-stack images of parkin (green), mitotracker red (red), DAPI (blue), and merged (yellow) were captured using LSM510 confocal microscopy, white arrows indicating formation of yellow punctae. (A)–MAO-B, (B) + MAO-B, (C) -MAO-B, 1 μM rapamycin pre-treatment, (D) – MAO-B, 4 μM FCCP treatment, (E) + MAO-B, 4 μM FCCP treatment, (F) –MAO-B, + FCCP, + rapamycin, (G) + MAO-B, + FCCP, + rapamycin.
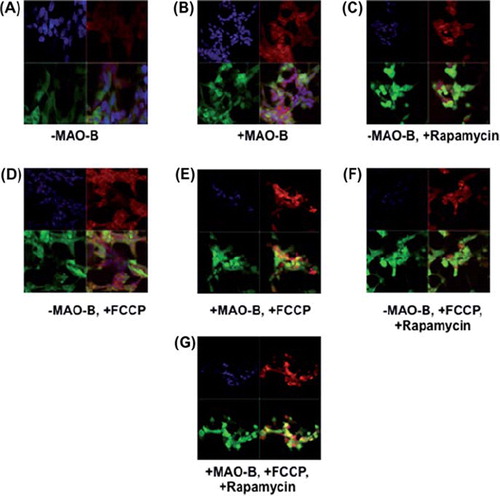
Figure 4. Cellular parkin levels in various conditions. Whole cell lysates fractions were analysed via Western blot analysis using flag antibody (Sigma); β-actin was used as loading control (Chemicon). Corresponding densitometric analyses are shown (n = 3). Values are expressed as mean ± SD; ***p < 0.001, **p < 0.01 versus –MAO-B cells.
Figure 5. Z-stack images of parkin (green), LC3 (red), and merged (yellow) were taken using LSM 510 confocal microscopy. (A)–MAO-B; (B) + MAO-B; (C)–MAO-B, 1 μM rapamycin; (D) + MAO-B, 1 μM rapamycin. Images were taken at the following parameters: (x) 126.8 μm x (y) 140.6 μm x (z) 7.0 μm.
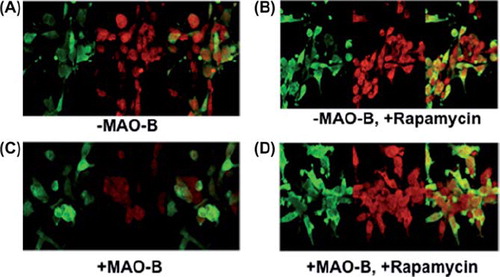
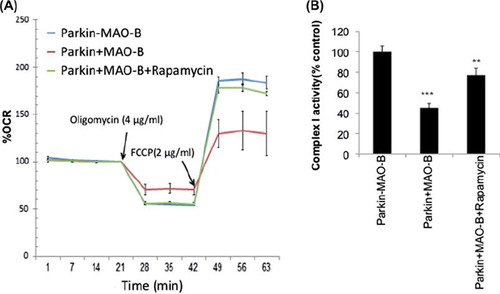
Figure 6. (A) Mitochondrial respiration measurements reported as percent oxygen consumption rate (OCR) versus –MAO-B controls in the absence or presence of oligomycin and FCCP application (at time of arrow) + /-rapamycin pre-treatment. (B) Mitochondrial complex I activity reported as percent –MAO-B controls. Values are expressed as mean ± SD ***p < 0.01 & **p < 0.001 compared to −MAO-B.