844
Views
22
CrossRef citations to date
0
Altmetric
Research Article

Targeted delivery of an anti-cancer agent via steroid coupled liposomes

, , , &
Pages 437-447 | Received 15 Jun 2009, Accepted 19 Aug 2009, Published online: 20 Oct 2009

Figures & data

Figure 1. Synthesis of testosterone-lipid conjugate (T-DSPE).

Figure 1.  Synthesis of testosterone-lipid conjugate (T-DSPE).

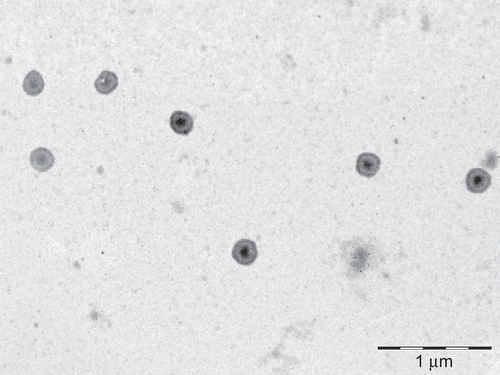
Figure 2. TEM photograph of T-DSPE coupled liposomes (80,000).

Figure 2.  TEM photograph of T-DSPE coupled liposomes (80,000).

Table 1. Characterization of uncoupled and testosterone (T-DSPE) coupled liposome formulations.

Figure 3. Fluorescent uptake after 1 h administration of 6-CF bearing uncoupled liposomes (alphabetical) and T-DSPE coupled liposomes (alphabetical artistic) in various androgen target organs. (A) Liver, (B) Prostate, (C) Testis, (D) Brain, (E) Spleen, (F) Kidney. The photographs clearly reveal that after administration of T-DSPE coupled liposomes the fluorescence of testosterone targeted organs is higher as compared to uncoupled liposomes, i.e. liver, prostate, testis, and brain, while non-target organs, i.e. spleen and kidney, show lesser fluorescence after administration of T-DSPE liposomes. It is clear that T-DSPE liposomes have better selectivity towards ARs targeted organs.
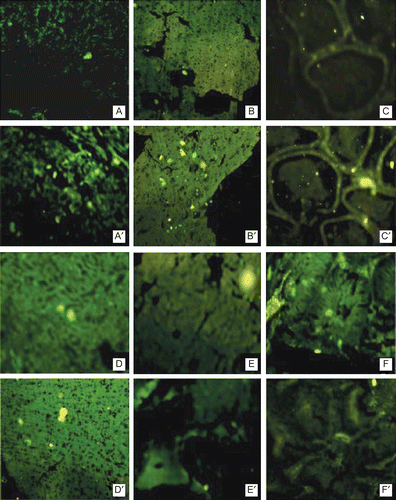
Figure 3.  Fluorescent uptake after 1 h administration of 6-CF bearing uncoupled liposomes (alphabetical) and T-DSPE coupled liposomes (alphabetical artistic) in various androgen target organs. (A) Liver, (B) Prostate, (C) Testis, (D) Brain, (E) Spleen, (F) Kidney. The photographs clearly reveal that after administration of T-DSPE coupled liposomes the fluorescence of testosterone targeted organs is higher as compared to uncoupled liposomes, i.e. liver, prostate, testis, and brain, while non-target organs, i.e. spleen and kidney, show lesser fluorescence after administration of T-DSPE liposomes. It is clear that T-DSPE liposomes have better selectivity towards ARs targeted organs.

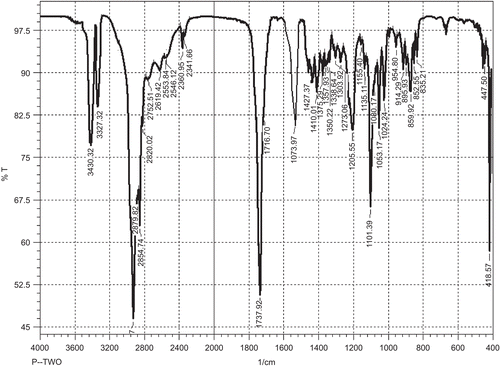
Figure 4. Infra red spectrum of testosterone-DSPE lipid (T-DSPE) conjugate.

Figure 4.  Infra red spectrum of testosterone-DSPE lipid (T-DSPE) conjugate.

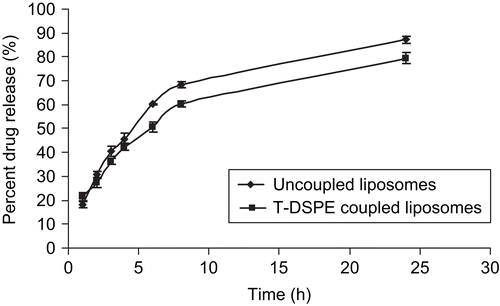
Figure 5. In vitro drug release of various liposomal formulations in PBS (pH 7.4) (n = 3).

Figure 5.  In vitro drug release of various liposomal formulations in PBS (pH 7.4) (n = 3).

Figure 6. Plasma drug level after administration of 5-FU drug solution and various liposomal formulations (n = 3).
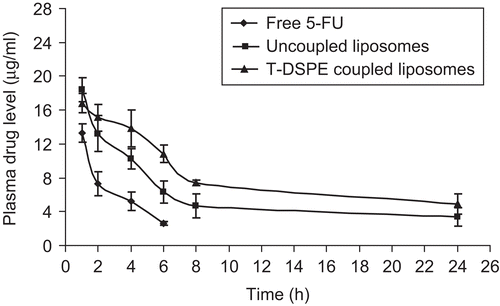
Figure 6.  Plasma drug level after administration of 5-FU drug solution and various liposomal formulations (n = 3).

Table 2. Drug recovered in various organs after various time intervals.
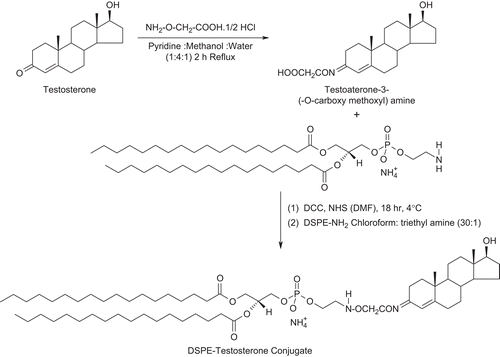
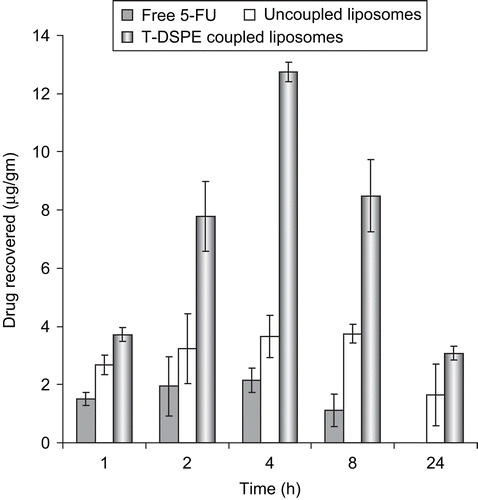
Figure 7. Accumulation of 5-FU in prostate tissues after administration of 5-FU drug solution, 5-FU bearing uncoupled liposomes and T-DSPE coupled liposomes (n = 3).

Figure 7.  Accumulation of 5-FU in prostate tissues after administration of 5-FU drug solution, 5-FU bearing uncoupled liposomes and T-DSPE coupled liposomes (n = 3).

Reprints and Corporate Permissions

Please note: Selecting permissions does not provide access to the full text of the article, please see our help page How do I view content?

To request a reprint or corporate permissions for this article, please click on the relevant link below:

Academic Permissions

Please note: Selecting permissions does not provide access to the full text of the article, please see our help page How do I view content?

Obtain permissions instantly via Rightslink by clicking on the button below:

If you are unable to obtain permissions via Rightslink, please complete and submit this Permissions form. For more information, please visit our Permissions help page.