1,564
Views
19
CrossRef citations to date
0
Altmetric
Research Article

Preparation of N,O-carboxymethyl chitosan nanoparticles as an insulin carrier

&
Pages 458-464 | Received 05 Aug 2009, Accepted 17 Sep 2009, Published online: 20 Oct 2009

Figures & data

Figure 1. FTIR spectra of chitosan and NOCC.

Figure 1.  FTIR spectra of chitosan and NOCC.

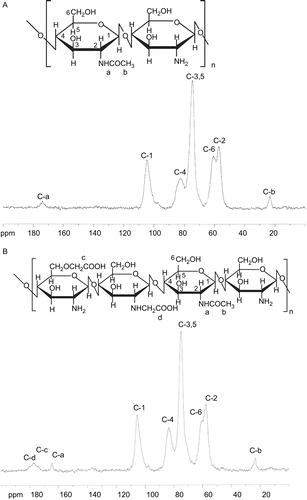
Figure 2. NMR spectrum of (A) chitosan, and (B) NOCC.

Figure 2.  NMR spectrum of (A) chitosan, and (B) NOCC.

Table 1. NOCC nanoparticles were obtained by inducing the gelation of different concentrations of NOCC with different concentrations of TPP, then samples were visually inspected and three different systems (•: clear solution, ▴: opalescent suspension, and ♦: aggregates) were identified.

Figure 3. TEM (the scale bar = 100 nm) of NOCC nanoparticles (A) NOCC-to-TPP weight ratio = 3, NOCC: 2 mg/ml; (B) NOCC-to-TPP weight ratio = 5, NOCC: 2 mg/ml; (C) NOCC-to-TPP weight ratio = 3, NOCC: 2 mg/ml, insulin: 0.5 mg/ml.
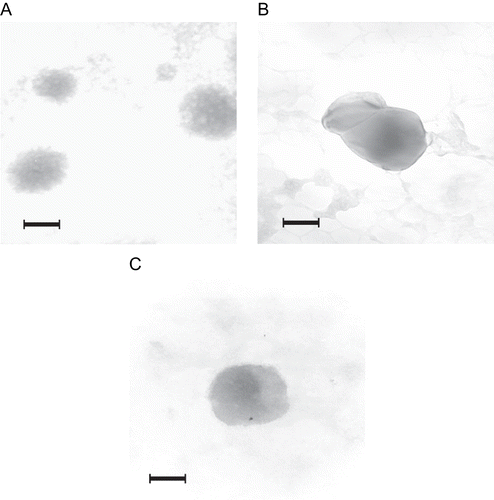
Figure 3.  TEM (the scale bar = 100 nm) of NOCC nanoparticles (A) NOCC-to-TPP weight ratio = 3, NOCC: 2 mg/ml; (B) NOCC-to-TPP weight ratio = 5, NOCC: 2 mg/ml; (C) NOCC-to-TPP weight ratio = 3, NOCC: 2 mg/ml, insulin: 0.5 mg/ml.

Figure 4. Influence of NOCC-to-TPP weight ratio on insulin encapsulation efficiency for insulin-loaded NOCC nanoparticles (NOCC: 2 mg/ml and insulin: 1 mg/ml) (mean ± SD, n = 3).
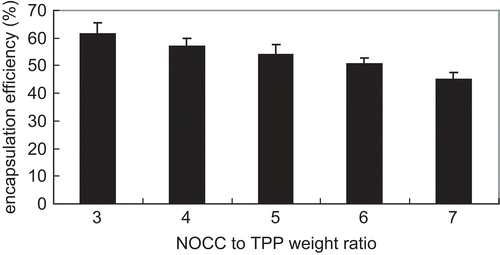
Figure 4.  Influence of NOCC-to-TPP weight ratio on insulin encapsulation efficiency for insulin-loaded NOCC nanoparticles (NOCC: 2 mg/ml and insulin: 1 mg/ml) (mean ± SD, n = 3).

Figure 5. Effect of pH of solutions on the particle size (♦) and zeta potential (▴) of insulin-loaded NOCC nanoparticles (NOCC-to-TPP weight ratio = 3, NOCC: 2 mg/ml, insulin: 0.5 mg/ml).
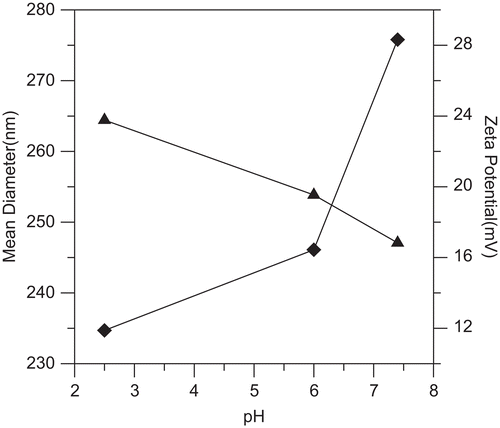
Figure 5.  Effect of pH of solutions on the particle size (♦) and zeta potential (▴) of insulin-loaded NOCC nanoparticles (NOCC-to-TPP weight ratio = 3, NOCC: 2 mg/ml, insulin: 0.5 mg/ml).
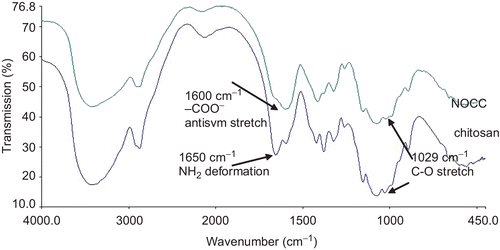
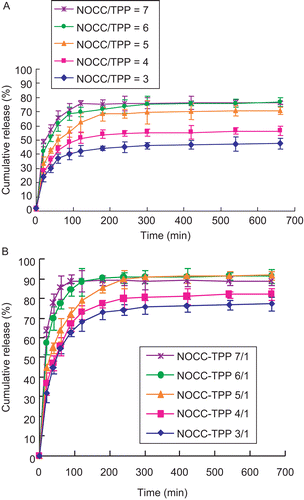
Figure 6. Influence of NOCC-to-TPP weight ratio on cumulative release of insulin from insulin-loaded NOCC nanoparticles (NOCC: 2 mg/ml and insulin: 0.5 mg/ml) in (A) pH = 2.5, and (B) pH = 7.4 of PBS (mean ± SD, n = 3).

Figure 6.  Influence of NOCC-to-TPP weight ratio on cumulative release of insulin from insulin-loaded NOCC nanoparticles (NOCC: 2 mg/ml and insulin: 0.5 mg/ml) in (A) pH = 2.5, and (B) pH = 7.4 of PBS (mean ± SD, n = 3).

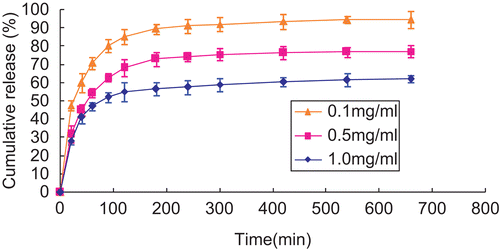
Figure 7. Influence of initial concentrations of insulin on cumulative release of insulin from insulin-loaded NOCC nanoparticles (NOCC-to-TPP weight ratio = 3, NOCC: 2 mg/ml) in pH = 7.4 of PBS (mean ± SD, n = 3).

Figure 7.  Influence of initial concentrations of insulin on cumulative release of insulin from insulin-loaded NOCC nanoparticles (NOCC-to-TPP weight ratio = 3, NOCC: 2 mg/ml) in pH = 7.4 of PBS (mean ± SD, n = 3).

Reprints and Corporate Permissions

Please note: Selecting permissions does not provide access to the full text of the article, please see our help page How do I view content?

To request a reprint or corporate permissions for this article, please click on the relevant link below:

Academic Permissions

Please note: Selecting permissions does not provide access to the full text of the article, please see our help page How do I view content?

Obtain permissions instantly via Rightslink by clicking on the button below:

If you are unable to obtain permissions via Rightslink, please complete and submit this Permissions form. For more information, please visit our Permissions help page.