837
Views
16
CrossRef citations to date
0
Altmetric
Research Article

Methylated N-(4-N,N-dimethylaminocinnamyl) chitosan enhances paracellular permeability across Caco-2 cells

, , , , &
Pages 301-312 | Received 24 Dec 2009, Accepted 16 Feb 2010, Published online: 19 Mar 2010

Figures & data

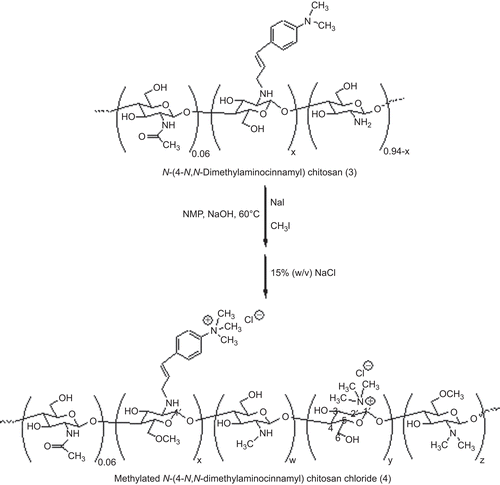
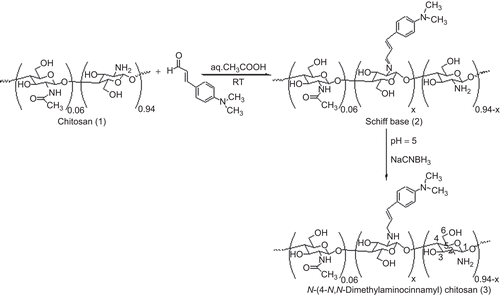
Scheme 1. Synthesis of N-(4-N,N-dimethylaminocinnamyl) chitosan.

Scheme 1.  Synthesis of N-(4-N,N-dimethylaminocinnamyl) chitosan.

Scheme 2. Synthesis of methylated N-(4-N,N-dimethylaminocinnamyl) chitosan (TM-CM-CS).

Scheme 2.  Synthesis of methylated N-(4-N,N-dimethylaminocinnamyl) chitosan (TM-CM-CS).

Table 1. Methylation of chitosan and N-(4-N,N-dimethylaminocinnamyl) chitosan (mean ± SD, n = 3).

Figure 1. 1H NMR spectra of (1) chitosan, (3a) N-(4-N,N-dimethylaminocinnamyl) chitosan, and (4a) methylated N-(4-N,N-dimethylaminocinnamyl) chitosan with ES 50%.
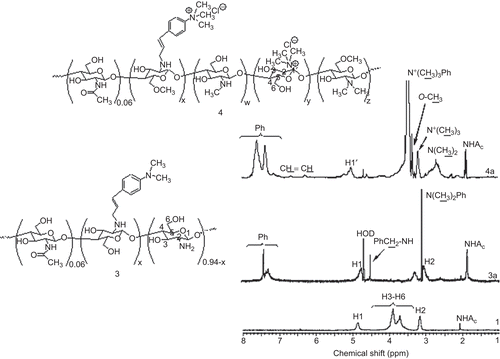
Figure 1.  1H NMR spectra of (1) chitosan, (3a) N-(4-N,N-dimethylaminocinnamyl) chitosan, and (4a) methylated N-(4-N,N-dimethylaminocinnamyl) chitosan with ES 50%.

Figure 2. FTIR spectra of (1) chitosan, (3b) N-(4-N,N-dimethylaminocinnamyl) chitosan, (4b) methylated N-(4-N,N-dimethylaminocinnamyl) chitosan with ES 76% and TM-CS.
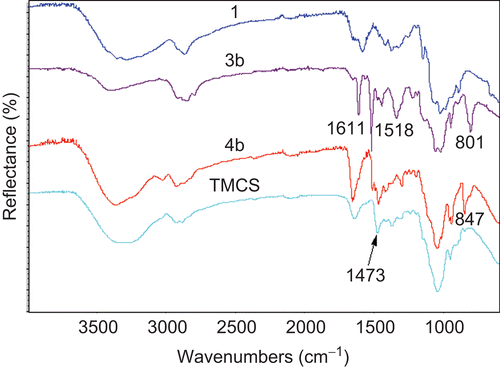
Figure 2.  FTIR spectra of (1) chitosan, (3b) N-(4-N,N-dimethylaminocinnamyl) chitosan, (4b) methylated N-(4-N,N-dimethylaminocinnamyl) chitosan with ES 76% and TM-CS.

Figure 3. The effect of TM-CM-CS on the TEER of Caco-2 cell monolayers: (a) TM65CM50CS, (b) TM82CM76CS. The TEER recovery pattern of the Caco-2 cell monolayers: (c) TM65CM50CS, (d) TM82CM76CS concentrations ranging from 0.05–5 mM, at pH 7.4 (♦) control, (▪) 0.05 mM, (▴) 0.5 mM, (◊) 1.25 mM, (□) 2.5 mM, (Δ) 5 mM. Each point represents the mean of three experiments. * p < 0.05.
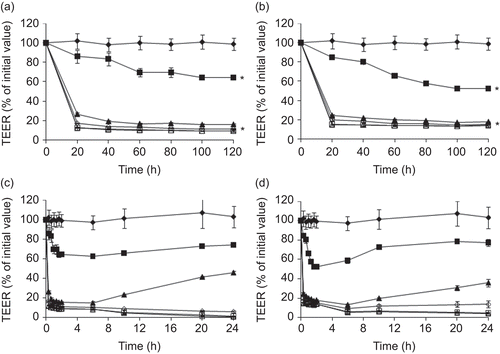
Figure 3.  The effect of TM-CM-CS on the TEER of Caco-2 cell monolayers: (a) TM65CM50CS, (b) TM82CM76CS. The TEER recovery pattern of the Caco-2 cell monolayers: (c) TM65CM50CS, (d) TM82CM76CS concentrations ranging from 0.05–5 mM, at pH 7.4 (♦) control, (▪) 0.05 mM, (▴) 0.5 mM, (◊) 1.25 mM, (□) 2.5 mM, (Δ) 5 mM. Each point represents the mean of three experiments. * p < 0.05.

Table 2. The effect of the degree of quaternization (DQ), the extent of N-substitution (ES) of TM-CM-CS, the polymer concentration and the pH on TEER.

Figure 4. The percentage of the reduction in TEER after 2 h incubation with 0.5 mM chitosan acetate (CSA) at pH 6.2 and 7.4 and chitosan derivatives at pH 7.4. Each point represents the mean of three experiments. * p < 0.05.
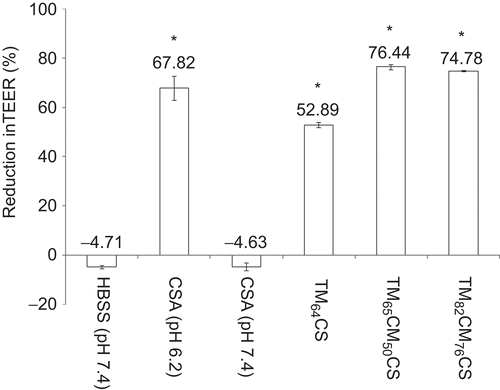
Figure 4.  The percentage of the reduction in TEER after 2 h incubation with 0.5 mM chitosan acetate (CSA) at pH 6.2 and 7.4 and chitosan derivatives at pH 7.4. Each point represents the mean of three experiments. * p < 0.05.

Table 3. The effect of different degrees of quaternization (DQ) and the extent of N-substitution (ES) of TM-CM-CS on the transport of FD-4.

Figure 5. Cumulative transport of FD-4 in the presence of 0.5 mM TM-CM-CS at pH 7.4 for 4 h: (♦) control, (x) TM64CS, (▴) TM65CM50CS, (▪) TM82CM76CS. Each point represents the mean of three experiments. * p < 0.05.
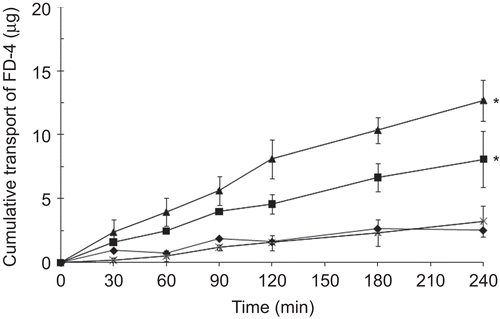
Figure 5.  Cumulative transport of FD-4 in the presence of 0.5 mM TM-CM-CS at pH 7.4 for 4 h: (♦) control, (x) TM64CS, (▴) TM65CM50CS, (▪) TM82CM76CS. Each point represents the mean of three experiments. * p < 0.05.

Table 4. Cytotoxicity TM-CM-CS incubated with Caco-2 cells for 2 and 24 h (n = 8).
Reprints and Corporate Permissions

Please note: Selecting permissions does not provide access to the full text of the article, please see our help page How do I view content?

To request a reprint or corporate permissions for this article, please click on the relevant link below:

Academic Permissions

Please note: Selecting permissions does not provide access to the full text of the article, please see our help page How do I view content?

Obtain permissions instantly via Rightslink by clicking on the button below:

If you are unable to obtain permissions via Rightslink, please complete and submit this Permissions form. For more information, please visit our Permissions help page.