851
Views
7
CrossRef citations to date
0
Altmetric
Research Article

Triamcinolone-loaded glutaraldehyde cross-linked chitosan microspheres: Prolonged release approach for the treatment of rheumatoid arthritis

, &
Pages 198-207 | Received 30 Apr 2010, Accepted 20 Sep 2010, Published online: 28 Oct 2010

Figures & data

Table 1.  Percentage of drug loading, encapsulation efficiency of chitosan microspheres.

Figure 1.  Scanning electron micrograph (SEM) of TA-loaded chitosan microspheres. (a) TA microspheres (10:1), (b) TA microspheres (5:1).
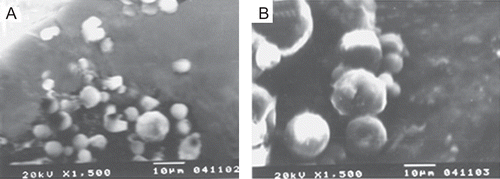
Figure 1.  Scanning electron micrograph (SEM) of TA-loaded chitosan microspheres. (a) TA microspheres (10:1), (b) TA microspheres (5:1).

Figure 2.  Differential scanning calorimetry (DSC) results of pure chitosan (a), pure TA (b), and TA-loaded chitosan microspheres (c).
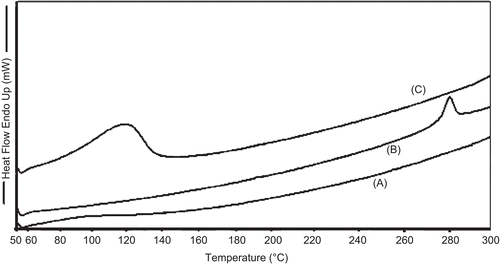
Figure 2.  Differential scanning calorimetry (DSC) results of pure chitosan (a), pure TA (b), and TA-loaded chitosan microspheres (c).

Figure 3.  FT-IR spectrum of pure chitosan (a), pure TA (b), and TA-loaded chitosan microspheres.

Figure 3.  FT-IR spectrum of pure chitosan (a), pure TA (b), and TA-loaded chitosan microspheres.

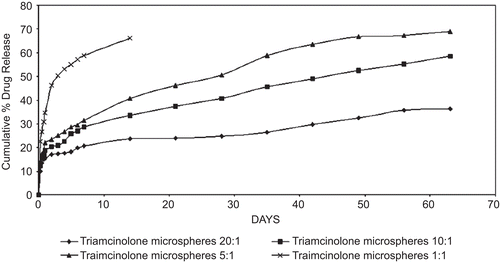
Figure 4.  In-vitro release study of various TA microsphere formulations.

Figure 4.  In-vitro release study of various TA microsphere formulations.

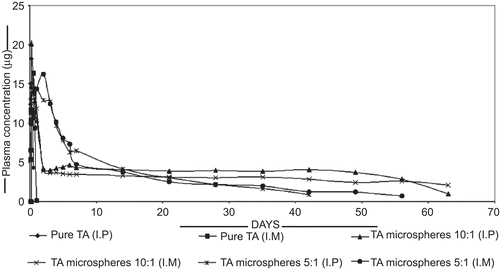
Figure 5.  Comparative in-vivo release study of pure TA and TA microsphere formulation.

Figure 5.  Comparative in-vivo release study of pure TA and TA microsphere formulation.

Table 2.  Paw volume with percentage inhibition and hemoglobin content.

Table 3.  Total leucocytes count.

Table 4.  Differential cell count.
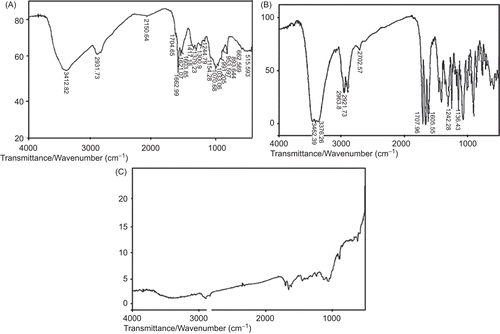
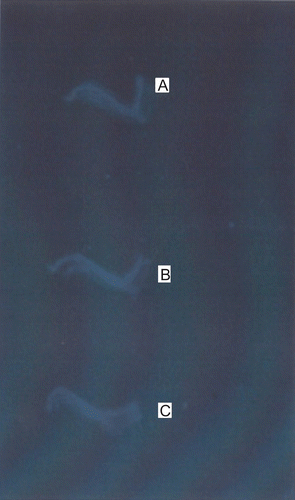
Figure 6.  Radiographs of joint were obtained at the conclusion of the study. Representative radiographs from Wistar rats with normal (a), Arthritic control (b), and TA-loaded chitosan microsphere treated (c).

Figure 6.  Radiographs of joint were obtained at the conclusion of the study. Representative radiographs from Wistar rats with normal (a), Arthritic control (b), and TA-loaded chitosan microsphere treated (c).

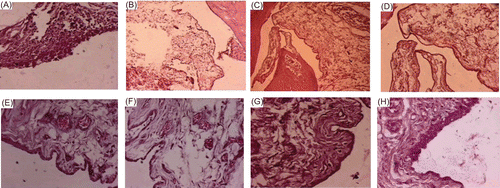
Figure 7.  Histopathological observation of inflamed tissues. (a and b) arthritic control; (c and d) normal architecture of synovial membrane, (e and f) TA-loaded chitosan microsphere treated group on 30th day, (g and h) TA-loaded chitosan microsphere treated group on 60th day.

Figure 7.  Histopathological observation of inflamed tissues. (a and b) arthritic control; (c and d) normal architecture of synovial membrane, (e and f) TA-loaded chitosan microsphere treated group on 30th day, (g and h) TA-loaded chitosan microsphere treated group on 60th day.

Reprints and Corporate Permissions

Please note: Selecting permissions does not provide access to the full text of the article, please see our help page How do I view content?

To request a reprint or corporate permissions for this article, please click on the relevant link below:

Academic Permissions

Please note: Selecting permissions does not provide access to the full text of the article, please see our help page How do I view content?

Obtain permissions instantly via Rightslink by clicking on the button below:

If you are unable to obtain permissions via Rightslink, please complete and submit this Permissions form. For more information, please visit our Permissions help page.