Figures & data
Table 1. Number-mean diameter (Nmd), polydispersity index (PdI), and surface zeta potential (ZP) of liposomes before and after coating by CS. CS/lipid (w/w) ratios of 1:20, 1:10, 1:5, 2:5, 3:5, 4:5, and 5:5 were evaluated. Each measurement is the mean of at least three measurements and the standard deviation of the mean is reported.
Figure 1. Morphology and size distribution of chitosan-coated liposomes. (A) Transmission electron micrograph, bar is 100 nm; (B) Size distribution counted by number.
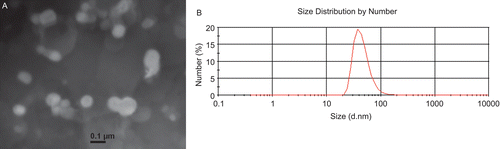
Figure 2. The influence of chitosan concentration on coating efficiency of CSLP. Each data point represents the mean of three independent experiments.
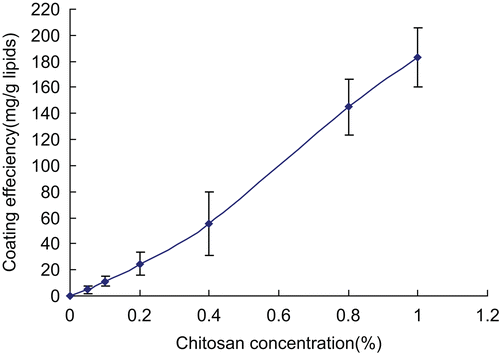
Figure 3. Cytotoxicity of liposome (![]()
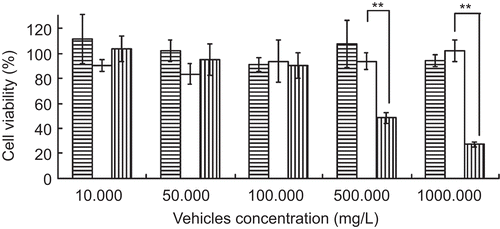
Figure 4. Agarose gel electrophoresis of CSLP-ASON complexes. Lanes from left to right: uncomplexed ASON (50 mg/L, Lane 1); CSLP-ASON complexes prepared at mass ratios of 1, 5, 25, 50, and 100 (from Lane 2 to Lane 6).
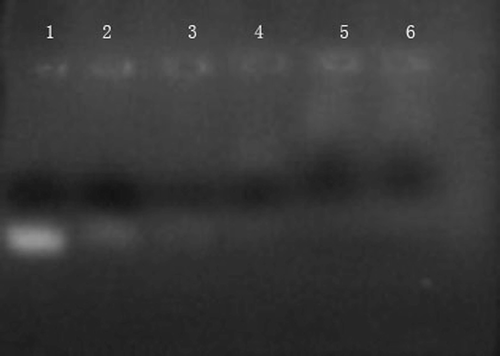
Figure 5. The effect of vehicles and its concentration on extent of ASON uptake in COS7. (a) Total intracellular fluorescence of COS7 after being co-cultured for 5 h with FAM-modified ASON combined to liposomes (![]()
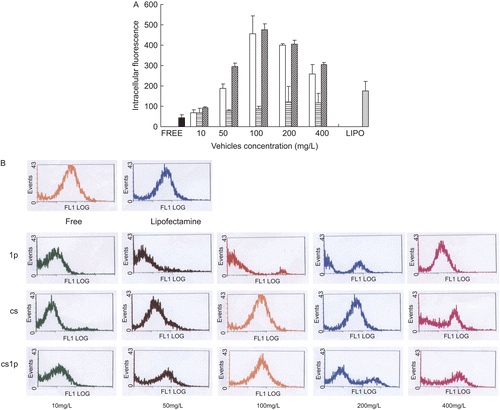
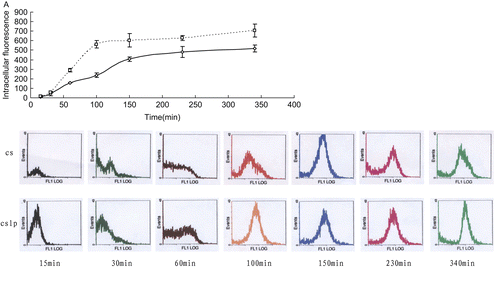
Figure 6. The uptake dynamics of ASON in COS7. (A) Total intracellular fluorescence of COS7 after being co-cultured for various times with FAM-modified ASON combined to chitosan (□) and chitosan-coated liposomes (◊). (B) Flow cytometric profiles of COS7 after being co-cultured with FAM-modified ASON combined to chitosan (cs) and chitosan-coated liposomes (cslp) for 15, 30, 60, 100, 150, 230, and 340 min (from left to right).