Figures & data
Table 1. Composition of leuprolide dosage forms for in vivo studies containing 1 mg of leuprolide.
Table 2. Characterization of leuprolide loaded nanoparticles.
Figure 1. Inter polymer complexation due to formation of hydrogen bonds between polyacrylic acid (A) and co-block-polymer Pluronic (B).
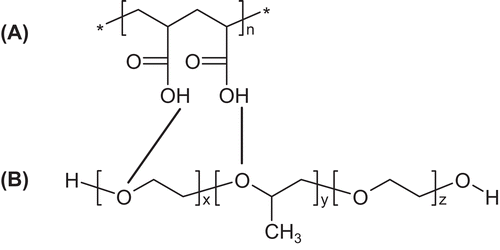
Figure 2. Absorbance monitoring during particle formation between PAA/Pluronic F68 (line) and PAA/PVP (dotted line). Abbreviations: OD (optical density).
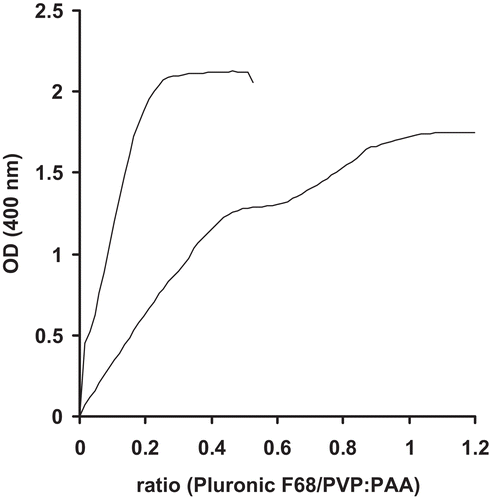
Figure 3. Release of leuprolide from nanoparticle suspension: Release of unbound and encapsulated leuprolide (▪) and release of encapsulated leuprolide only (▴). Indicated values represent means (± S.D.) of at least three experiments.
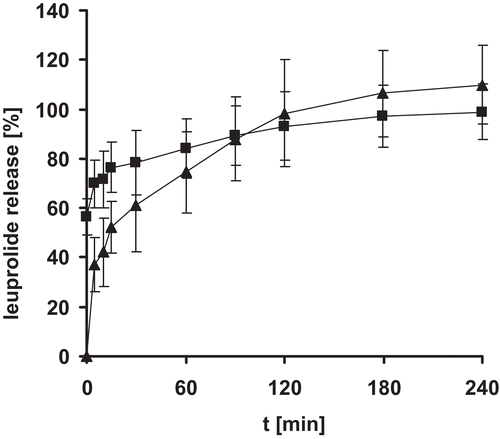
Figure 4. Release of leuprolide from nanoparticle tablets. Indicated values represent means (± S.D.) of at least three experiments.
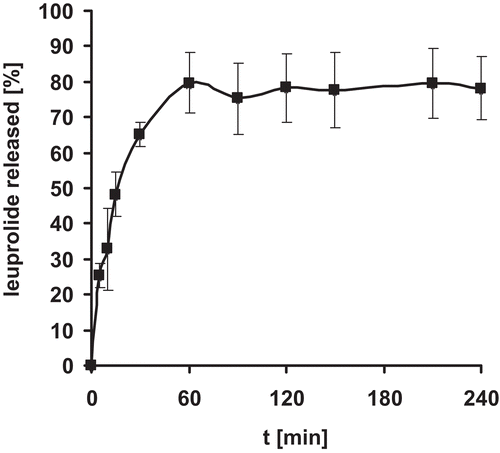
Table 3. Pharmacokinetic parameters of leuprolide dosage forms (* differs significantly from PAA control tablets with p<0.05). Abbreviations: F=absolute bioavailability, f=improvement ratio.
Figure 5. Plasma leuprolide levels [ng/ml] after administration of 1 mg of leuprolide to rats: PAA tablets (□), PAA NP tablets (▪), solution (Δ). Indicated values represent means of at least three experiments. Indicated values represent means (± S.D.) of at least three experiments. 1 differs from 2 and 3 p = 0.0001.
![Figure 5. Plasma leuprolide levels [ng/ml] after administration of 1 mg of leuprolide to rats: PAA tablets (□), PAA NP tablets (▪), solution (Δ). Indicated values represent means of at least three experiments. Indicated values represent means (± S.D.) of at least three experiments. 1 differs from 2 and 3 p = 0.0001.](/cms/asset/894883bb-da18-4dd6-a03a-58ebd1db442a/idrd_a_577108_f0005_b.gif)
![Figure 6. Plasma leuprolide levels [μg/ml] after intravenous (▪) and subcutaneous (□) administration of 1 mg of leuprolide to rats. Indicated values represent means (± S.D.) of at least three experiments. 1 differs from 2 p = 0.0001.](/cms/asset/9d402708-7592-4cdc-86e9-9d56908b1ffc/idrd_a_577108_f0006_b.gif)
